


Progress bar layout powerpoint images






Try Before you Buy Download Free Sample Product
 Impress Your
Audience
 100%
Editable
 Save Hours
of Time


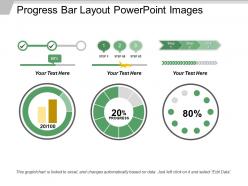
Interpret the progress made by your business using the beautiful Progress Bar Layout PowerPoint Images. Acquaint your team with the current status of their tasks by measuring the level of progress with the help of the progress bar present in the PowerPoint template. A progress bar depicts the results in a linear process. The PowerPoint layout includes three different progress bars that can be used to describe various tasks at one go in a synchronized manner. The progress bars are depicted along with a radial diagram illustrating the progression which makes the understanding of the audience easier. Add the tasks and percentage of the work done in your organization and create a great visual representation of the productivity of your company. This progress bar PPT image can also be used to bring out the contrast between the various attributes of a specific company. Download this PowerPoint template now and measure the progression of your firm in a correct manner.
People who downloaded this PowerPoint presentation also viewed the following :
Progress bar layout powerpoint images with all 5 slides:
Our Progress Bar Layout Powerpoint Images assist in handling dissent. Your arguments will facilitate agreement.

FAQs for Progress bar
Honestly, just make sure people can actually see the damn thing first - those razor-thin progress bars are pointless. You'll want clear labels showing like "Step 2 of 5" plus what's actually happening. Put it somewhere obvious but not annoying, usually near the top works. Keep animations smooth without being distracting. Time estimates are clutch if you can swing them, but only if they're realistic. I always test mine with real loading scenarios because there's nothing worse than a progress bar that stutters or jumps around randomly. Oh, and descriptive text helps too - users hate being left in the dark.
Colors totally mess with people's heads when it comes to progress bars. Green feels like you're winning, but red? Even for normal loading, it makes users think something's broken. I've actually seen apps stress people out just because they picked the wrong shade. Blue comes across as trustworthy, though it can feel sluggish. Orange and yellow scream "hurry up!" which works great for checkout flows but maybe not so much for file uploads. Honestly, test this stuff with real users. What looks fine to you might drive someone else crazy for reasons you'd never think of.
Make your progress bar around 200-400px wide on desktop. Any shorter and users won't notice small changes. Too long feels intimidating honestly. Don't get obsessed with exact percentages - nobody cares if it's "47.3% complete." Break things into 5-10 clear steps instead. For file uploads, show phases people actually understand rather than technical stuff. You want enough detail so they see progress happening, but not so much they're stressing over every tiny increment. Test a few different lengths with your real content - what feels right varies depending on what you're actually tracking.
Honestly, animated progress bars are such a game changer for user experience. When people see that smooth fill animation or even a subtle pulsing effect, they know something's actually happening - way better than those dead static bars that make you wonder if your browser froze. I always go with ease-in-out transitions since they look way more polished. The whole point is keeping users calm during wait times. Just don't go overboard with flashy stuff that becomes annoying. Keep it smooth and purposeful, and you'll immediately notice how much better it feels.
Okay so ARIA labels are huge - screen readers need to announce the progress percentage. Don't just use color alone because colorblind folks won't see the difference (learned this one the hard way). Text labels showing actual percentages help everyone. Oh and make sure there's enough contrast between colors. When someone's using keyboard navigation, they should hear updates as things progress. Honestly though? The best thing you can do is test it yourself with a screen reader. You'll catch stuff you never thought of. Short version: make it work for everyone, not just mouse users.
Yeah, industries totally switch up their progress bars depending on their crowd. Tech companies are obsessed with those multi-step ones that show development phases. Healthcare? They're all about patient journeys and treatment timelines. Financial services goes nuts with milestone tracking - loan approvals, investment growth, that whole thing. Manufacturing sticks to production workflows and quality checks. Honestly, finance ones can be pretty overwhelming with all those stages. But it makes sense - you gotta match what your audience expects to see and how they actually think about getting stuff done in their field.
Dude, feedback makes all the difference with progress bars. Without it, users just stare at this thing wondering if their browser crashed or something. You want to show them what's actually happening - like "Processing payment" or throw in a percentage. Give people a rough time estimate too if you can. Short sentences work great here. The boring bars that just sit there doing nothing? Those are the worst - I always end up refreshing the page thinking something broke. When users know what stage they're in, they'll actually stick around instead of bouncing.
Ditch the fixed pixel widths and go with percentages or viewport units instead. Make those bars way taller on mobile - trust me, fat fingers need the space. Labels should stack above the bar on phones, not squeeze beside it. Media queries are your friend here - 100% width on mobile, maybe cap it around 400px for desktop. Oh and add proper padding around text so people can actually tap stuff without missing. Honestly the mobile testing part is where most people mess up, so def check it on your actual phone before calling it done.
Hey! So first thing - don't overcomplicate it. People zone out when there's too much detail crammed in. I made this mistake once with tiny text and like 15 steps... nobody could follow it lol. White space is your friend here, seriously. Everything looks messy without it. Also those fancy loading animations? Skip them, they're annoying. Stick to maybe 5-7 steps tops. Your colors should actually mean something consistent throughout. Oh and pro tip - always check how it looks from way back in the room before you present. Trust me on that one.
Dude, basic progress bars are honestly pretty worthless without context. Add color coding - green when done, yellow for in-progress, red if something's stuck. Throw in percentage labels or time estimates too. Here's what really helps: show milestones along the bar so people know what's coming. I'd also add hover tooltips with detailed breakdowns - like, what does "47% complete" actually mean for their specific task? Short version: give users multiple ways to understand their progress. Don't make them decode some random percentage without knowing what it represents in real terms.
Mobile screens need thicker progress bars - like 8-10px minimum or they'll look tiny. Stack your labels vertically too, otherwise the text gets all squished. Desktop's different since you've got space to work with. Thinner bars look fine and you can do horizontal layouts. Here's the thing though - mobile users are juggling ten things at once while they wait. Throw in some percentage numbers or time estimates because that tiny visual bar isn't gonna cut it. Oh, and test on real devices, not just shrinking your browser. That never gives you the full picture.
So I've seen customized progress bars bump engagement by like 15-25% over generic ones. Makes sense though - people actually notice when the design fits your brand instead of just throwing in some random spinner. The trick is making it meaningful, not just pretty. Honestly, I'd rather see a boring bar that tells me what's happening than some flashy animation that's just... there. Start with your brand colors and maybe add labels that explain the process. You can always get fancier later, but don't overcomplicate it right away.
Web-based is definitely the way to go for dynamic progress bars since they update smoothly in real-time. CSS animations with JavaScript work great - Progress.js and NProgress are solid libraries that'll save you time. React has some nice progress components if you're already using it, and Vue handles reactive updates really well too. Plain CSS transitions actually look pretty decent now, which honestly surprised me when I first tried them. D3.js gives you crazy control for complex dashboards but yeah, the learning curve is rough. I'd start with basic CSS/JS and then move to frameworks when things get complicated.
User testing is where you'll actually see what's broken. Try A/B testing different styles - maybe linear vs stepped, or percentages vs step numbers. Watch people use it for real tasks (not just pretty mockups). Do they bail at step 3? Get lost halfway through? Honestly, I've seen so many "intuitive" designs that totally weren't. Different positions on the page can make a huge difference too. Once you see how people actually behave, you can tweak the design and labels to guide them better through your flow.
Honestly, animated progress bars are everywhere now - they actually move during presentations instead of just sitting there. Way more engaging than static ones. Minimalist designs are big too, with clean lines or subtle gradients replacing those chunky bars from before. Multi-step indicators are pretty popular since they show what's coming next, not just where you are. But here's the thing - fancy animations can totally backfire if you go overboard. I've seen decks where the progress bar was more distracting than the actual content, which defeats the whole point. Just make sure whatever style you pick actually helps your audience follow along. Maybe try a couple different options in your next presentation and see what clicks?
-
Wonderful templates design to use in business meetings.
-
Unique research projects to present in meeting.