


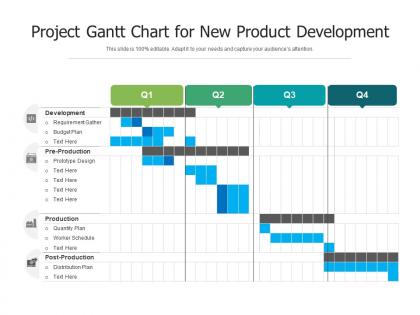
Project gantt chart for new product development




Try Before you Buy Download Free Sample Product
 Impress Your
 Audience
 100%
100% Editable
 Save Hours
 of Time


Our Project Gantt Chart For New Product Development are topically designed to provide an attractive backdrop to any subject. Use them to look like a presentation pro.
People who downloaded this PowerPoint presentation also viewed the following :
Project gantt chart for new product development with all 2 slides:
Use our Project Gantt Chart For New Product Development to effectively help you save your valuable time. They are readymade to fit into any presentation structure.
FAQs for Project gantt chart for
Honestly, Gantt charts are a game changer for seeing your whole project laid out. You'll spot bottlenecks way before they bite you in the ass. Dependencies become super clear too - like knowing Task B can't start until Task A wraps up. Clients eat up those colorful timeline bars, which is weird but whatever works, right? Critical path stuff becomes obvious, and when deadlines inevitably shift (because they always do), you can adjust things quickly. Resource planning gets easier too. Start simple - even Excel works fine for basic charts. Trust me, once you try one you won't go back to messy task lists.
Honestly, Gantt charts are a lifesaver for keeping everyone on the same page. Your team can instantly see who's doing what and when stuff's due. Like if Sarah's running behind, you'll know right away how it affects Mike's timeline - saves tons of awkward "hey, where are we on this?" conversations. Everyone stays accountable since their progress is right there for all to see. Stakeholders bugging you for updates? Just show them the chart instead of fumbling through explanations. One thing though - you gotta keep it updated or it becomes totally useless. Trust me on that one.
So there's basically four main parts to a Gantt chart. Tasks go down the left side, timeline runs across the top. Then you've got bars showing how long each task takes and when it happens. Dependencies are where it gets tricky though - that's the lines connecting tasks that depend on each other. Most people skip this part but honestly it's what makes the whole thing useful. Oh, and throw in some milestones for big deadlines. I mean, you could add who's doing what task too, but start simple. Trust me, even a basic one beats trying to juggle everything mentally.
Honestly, there's so much you can do with Gantt charts once you dig in. Custom columns are clutch - throw in budget tracking, resources, priority levels, whatever you need. Timeline scaling is huge too; switch from daily view to weekly or monthly for bigger projects. Color-coding saves your sanity - team assignments, task status, departments, you name it. Dependencies and milestones are pretty standard now. Oh, and most tools let you create custom fields for weird metrics you're tracking. My advice? Don't go crazy at first. Pick your most critical stuff and add features as you go.
Honestly, Microsoft Project is super powerful but total overkill unless you're managing something massive. Asana and Monday.com are way more user-friendly - your team won't hate you for picking them. ProjectLibre is decent if you need something free, though the interface feels a bit dated. I'm personally a fan of Smartsheet since it's like Excel but actually useful for project timelines. Oh, and whatever you pick, make sure it plays nice with the other tools you're already using. Nothing worse than creating extra work just to track work, you know?
So with Gantt charts, I usually add deadlines as those diamond-shaped milestone markers at specific dates. Then just work backwards from there to schedule everything. Make them red or something bright - honestly, you don't want to miss those! Oh, and definitely build in buffer time before each deadline. Like, way more than you think you need. I learned that one the hard way lol. For big projects, throw in milestones at major phases too - "design done," "testing wrapped up," whatever makes sense. Really helps you catch delays before they become disasters. The checkpoints are clutch for staying on track.
Honestly, the two big ones are making it way too complicated and then forgetting to update the damn thing. Skip all the tiny tasks - you'll just create this massive chart nobody wants to deal with. Timelines are always wrong too (we're all terrible at estimating lol), so pad them more than feels right. Focus on the big milestones and what depends on what, not every little detail. Keep updating it or it becomes totally pointless within like two weeks. I learned this the hard way - simple charts that actually get maintained beat fancy ones every time.
Oh man, I used to confuse these constantly! So Gantt charts are basically timelines - they map out when stuff starts and ends, plus show how tasks connect. Super useful for project planning. Kanban boards are totally different though. They're more about moving work through stages like "To Do" → "Doing" → "Done." Way better for day-to-day stuff when you just want to see what's on your plate right now. I'd go Gantt when you need the big picture timeline, Kanban for managing your daily workflow. Makes way more sense once you think about it that way!
Yeah, you can totally use Gantt charts with agile! Most teams do them for individual sprints or releases instead of mapping the whole project upfront. They're actually pretty solid for showing dependencies and timelines. Executives eat that visual stuff up, so they're great for stakeholder meetings. Just keep updating them constantly as priorities change - and trust me, they will change. Don't get married to your original plan though. Treat it like a living doc that shifts after each retrospective. The flexibility thing is key here.
Honestly, Gantt charts are like having a crystal ball for your projects. You can see exactly where things will crash before they do - super helpful when you're trying to avoid disaster. They're great for catching resource conflicts too, like when someone gets triple-booked (classic mistake). The visual timeline makes it obvious when deadlines are completely unrealistic, so you can push back or get more help. Stakeholders actually pay attention to them unlike boring spreadsheets. Oh, and color-coding by team makes everything way easier to read at a glance.
Okay so first thing - save a copy of your current chart before you touch anything! Learned that the hard way once. Then tackle the task durations and dependencies because those changes cascade through everything else. After that, fix your resource assignments and move any milestones around. Honestly, the dependency stuff is usually what trips people up the most. Make sure you update your baseline in whatever tool you're using, and shoot a message to your team right away so nobody's working off the old version. Version control is key here - you don't want half the team looking at different timelines.
Honestly, Gantt charts are lifesavers for keeping stakeholders in the loop. They can glance at it and immediately see what's finished, what's behind schedule, and what's up next. Way better than those long status emails that half the team skips reading anyway. Everyone's looking at the exact same timeline during meetings, which really cuts down on the whole "wait, I thought we were doing X first" confusion. Your stakeholders actually get engaged because they can see how their piece fits into everything else. Oh, and they can check progress themselves instead of constantly bugging you for updates - which is honestly the best part.
So critical path analysis shows you which tasks can't be delayed without screwing up your whole deadline. When you put it on your Gantt chart, boom - you can see exactly which activities have zero buffer time and which ones have some breathing room (that's called float). Honestly, it's like having project GPS that shows you where the bottlenecks are gonna hit. You'll know where to throw extra resources when things get crazy. Way better than just guessing which tasks actually matter for your timeline. Makes decision-making so much clearer when you're in crunch mode.
Honestly, Gantt charts are a game-changer for remote work. Everyone can see who's doing what without having to hunt people down across different time zones. The visual timeline thing really helps when you can't just peek over someone's shoulder, you know? Dependencies become super obvious, and you'll catch problems way earlier. I've been using Asana for this - it's pretty solid because everyone can update their own tasks directly. Monday.com works too, though it's a bit pricier. Real-time updates mean fewer "hey, where are we on this?" Slack messages, which honestly saves everyone's sanity.
Oh definitely construction and software dev are huge for this stuff. Manufacturing too - you've got all these dependencies where one step has to finish before the next can start. Event planning is another big one since there's so much coordination involved. Marketing teams love Gantt charts for campaign launches because honestly, trying to track creative assets and approvals without a visual timeline is a nightmare. Basically any project where you have multiple teams or phases that need to happen in order will benefit from mapping it out. Really helps you catch bottlenecks before they mess up your whole schedule.
-
Design layout is very impressive.
-
Unique and attractive product design.