


Projected profit and loss statement strategical planning for opening a cafeteria




Try Before you Buy Download Free Sample Product
 Impress Your
 Audience
 100%
100% Editable
 Save Hours
 of Time


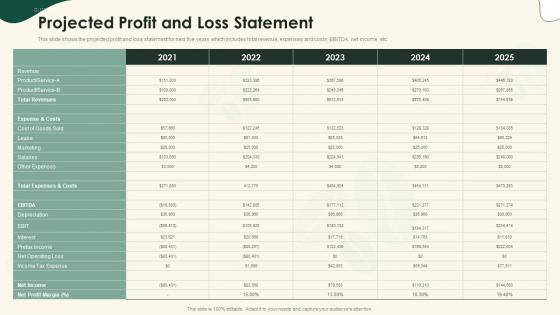
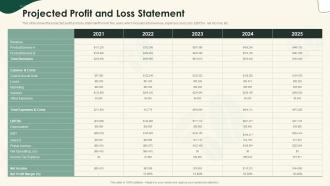
This slide shows the projected profit and loss statement for next five years which includes total revenue, expenses and costs, EBITDA, net income, etc.
People who downloaded this PowerPoint presentation also viewed the following :
Projected profit and loss statement strategical planning for opening a cafeteria with all 6 slides:
Use our Projected Profit And Loss Statement Strategical Planning For Opening A Cafeteria to effectively help you save your valuable time. They are readymade to fit into any presentation structure.





FAQs for Projected profit and loss statement strategical planning for
So you'll need revenue projections, cost of goods sold, and operating expenses - stuff like rent, salaries, marketing. Don't forget interest, taxes, and depreciation (ugh). Honestly the math is easy: revenue minus COGS gives you gross profit, then subtract operating expenses for operating profit. The hard part? Making realistic assumptions. I always start conservative with revenue - better to underestimate than get crushed later. Oh and be super detailed with expenses, that's where people usually mess up. Trust me on this one.
Look at your sales data from the last 2-3 years first - spot any trends or seasonal stuff. Factor in big changes coming up like new products or market shifts. Honestly, don't just go with your gut because we've all been wrong before! Cross-check everything with trend analysis, customer surveys, maybe some market research. Be realistic instead of super optimistic (learned that one the hard way). Oh, and build different scenarios - best case, worst case, most likely. That way you're not scrambling if things go sideways.
So basically, you've got two types of costs that'll make or break your P&L projections. Variable costs go up and down with your sales - stuff like materials and commissions. Fixed costs? Those are your rent, salaries, insurance that stay the same whether you're crushing it or having a slow month. Here's the thing though - you really need to separate these when you're building projections. It helps you figure out your break-even point and what happens to your margins when sales change. Trust me, it makes scenario planning way easier when you can actually see how volume affects everything.
Look, seasonal swings will mess up your P&L big time if you ignore them. Revenue spikes during peak months while costs stay flat - makes some periods look way better than they actually are. Holiday retail is crazy profitable, landscaping booms in summer, you know the drill. Build those patterns into your projections from the start or you'll freak out during slow months. Honestly, I learned this the hard way with my first business. Pull at least 2-3 years of data to spot the cycles, then bake those ups and downs right into your monthly forecasts.
Put all your key assumptions right at the top - sales growth, pricing changes, seasonal stuff, major cost bumps you're expecting. Include the boring basics too like revenue recognition and tax rates because trust me, someone will ask about literally everything later. Market assumptions and staffing plans should go in there as well, plus any one-time expenses coming up. More transparency upfront = fewer annoying questions in meetings (learned this the hard way). Create a separate assumptions page so people can actually find this stuff when they need it.
Honestly, monthly is ideal but quarterly works too if you're swamped. Markets change fast and your numbers get outdated quick - I learned this the hard way. Revenue shifts, costs jump around, and suddenly your projections are useless. Big changes like launching new products? Update immediately. Don't be like the companies I've watched cling to six-month-old forecasts while missing obvious trends. Treat it like a living doc, not some set-it-and-forget-it thing. Just throw a monthly reminder on your calendar. Trust me, you'll catch problems way earlier.
Depends what you're comfortable with honestly. Most people just use Excel or Google Sheets since they're flexible and you probably already have them. QuickBooks, Xero, and FreshBooks sync with your actual numbers which is pretty sweet. There's fancier stuff like LivePlan and PlanGuru if you want industry benchmarks and all that. But here's the thing - I've seen people nail projections in basic spreadsheets while others completely bomb with expensive software. Your assumptions matter way more than the tool. Start with whatever you've got and maybe upgrade later if you feel limited.
Look, a solid P&L projection shows you're not just winging it. Banks want proof you can handle cash flow and actually pay them back - pretty reasonable when you think about it. Investors are looking at growth potential and ROI. The key is making your numbers realistic and detailed enough that you seem credible. Don't just throw random figures together though. They'll definitely grill you on every assumption you made, so you better know how you got there. It's basically your way of proving you've thought this whole thing through.
Ugh, the classic mistakes? Being way too optimistic with revenue and totally lowballing expenses. I swear this kills more businesses than anything else. Pad your expense estimates by like 10-20% minimum. Transaction fees, insurance hikes, seasonal dips - all that stuff adds up fast. Also don't assume you'll grow in a straight line because... lol, when does that ever happen? Always build in buffer time for when cash gets tight. Oh, and start with fixed costs first, then add variables on top. Makes the whole picture way clearer.
Your P&Ls from the past 2-3 years are gold for spotting what'll probably happen again. I'd dig into those first - look for stuff that keeps showing up, like maybe you always see a revenue bump in December or your costs spike every spring. Those are real patterns worth betting on. Just don't get fooled by one-time weirdness (learned that the hard way). Start with what's been averaging out, then tweak based on changes you know are coming. Honestly, the hardest part is figuring out what's an actual trend versus just random noise.
Look, gross profit margin is just how much cash you're left with after paying for the stuff you sell - think of it as your cushion. When you're building projected P&Ls, this number matters big time because it shows if your business can actually survive. Calculate it by dividing gross profit by revenue. Honestly, I've seen too many people ignore this and then wonder why they're bleeding money. Thin margins mean you'll barely cover rent and salaries. It's perfect for catching pricing screwups early or realizing you need better supplier deals. Watch it like a hawk.
Hey! So external economic stuff can really mess with your P&L forecasts. Interest rates going up means higher borrowing costs and customers spend less. Inflation hits you twice - your expenses go up AND you have to figure out pricing. Market downturns obviously hurt demand (learned that one the hard way). Currency changes are annoying even for smaller businesses if you buy from overseas suppliers. Oh, and unemployment rates affect both what customers buy and what you'll pay employees. Honestly, just build in some wiggle room and update your numbers quarterly when things inevitably shift around.
Build projections bottom-up instead of just slapping on growth percentages. Break revenue down by customer segments or product lines - whatever actually makes sense for your business. Way better control that way. Create three scenarios too: conservative, realistic, optimistic. Growing companies are unpredictable as hell. Update monthly with real performance data and pivot when things don't match up. Oh, and track leading indicators that predict what's coming, not just the financial stuff that already happened. That's been a game-changer for us.
Look, getting input from your team makes P&L forecasts actually realistic instead of wishful thinking. Your sales folks know what deals are really closing. Operations gets the cost side way better than you do sitting at your desk. When people help build the numbers, they're way more committed to hitting them - it's weird but true. Finance can catch assumptions that make zero sense too. Honestly, I've watched so many projections crash because someone built them solo. Just get everyone together, go through each line item, and you'll have something that won't embarrass you in front of the executives.
Cash flow projections are huge - way more important than most people realize since being profitable on paper means nothing if you're broke. Budget variance reports will show you where you're actually hitting vs missing your targets. I always look at gross margin, operating margin, and burn rate too. Break-even analysis is pretty essential. Monthly variance tracking has literally saved my ass so many times from cash crunches I didn't see coming. The P&L shows profitability but these other metrics? That's where you see if you're actually healthy or just look good on spreadsheets.
-
Perfect template with attractive color combination.
-
Great designs, really helpful.