


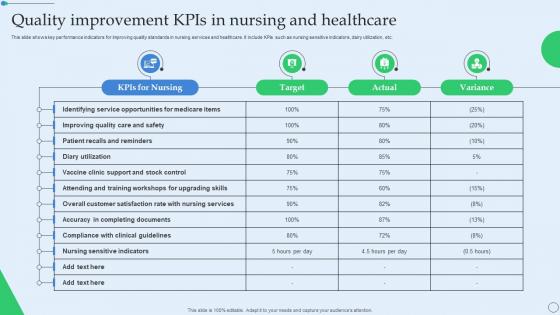
Quality Improvement KPIs In Nursing And Healthcare




Try Before you Buy Download Free Sample Product
 Impress Your
 Audience
 100%
100% Editable
 Save Hours
 of Time


This slide shows key performance indicators for improving quality standards in nursing services and healthcare. It include KPIs such as nursing sensitive indicators, dairy utilization, etc.
People who downloaded this PowerPoint presentation also viewed the following :
Quality Improvement KPIs In Nursing And Healthcare with all 6 slides:
Use our Quality Improvement KPIs In Nursing And Healthcare to effectively help you save your valuable time. They are readymade to fit into any presentation structure.





FAQs for Quality Improvement KPIs In
Honestly, I'd start with the big ones - patient safety stuff like hospital infections and med errors, plus readmission rates and patient satisfaction scores. Those really tell the story. Mortality rates for specific conditions are huge too, obviously. Length of stay and treatment wait times show if you're actually running things efficiently (which patients definitely notice). Your setting totally changes what matters most though - ICUs obsess over ventilator pneumonia while outpatient places care more about appointment scheduling. Pick maybe 3-4 that directly hit patient outcomes first, then add more once you've got good baseline data to work with.
First thing - figure out what "quality" actually means for your business. Healthcare? Patient safety matters most. Manufacturing? You're looking at defect rates. Totally different games. Check your industry regulations and what customers expect, then build your KPIs around those specific pain points. Honestly, don't just steal what competitors are doing - they might be tracking the wrong stuff anyway. Pick maybe 3-5 metrics that actually move the needle for customers and your profits. Start simple and tweak as you learn what works.
Look, customer satisfaction scores are your gut check for whether quality improvements actually work. You might polish processes all week, but if customers aren't happier? Wrong focus. Track NPS or complaint times next to your regular metrics - honestly, this combo saves so much wasted effort. Map out which internal changes bump satisfaction scores. That's your goldmine right there. It's like having customers tell you exactly where to spend your time instead of guessing what matters to them.
Honestly, data analytics is a lifesaver for cleaning up messy KPI data. You'll catch patterns that would fly right over your head otherwise. Manual reporting? Always full of errors - I learned that the hard way. Analytics helps spot outliers and validates whether you're tracking the right stuff. It'll flag weird numbers before you embarrass yourself in front of leadership (been there!). The trick is setting up decent data pipelines. Then you can use stats to double-check your metrics are actually legit. Way better than crossing your fingers and hoping everything's accurate.
Don't measure everything - you'll just get lost in all the numbers. Pick vanity metrics and you're basically wasting your time (like counting how many improvement projects you have instead of actual results). Your frontline people know the processes best, so definitely get them involved early. Rolling out 10 KPIs at once? Yeah, that never works. I'd stick to maybe 3-5 metrics that your team can actually control. Make sure each one connects to a real quality outcome you care about. Oh, and get buy-in from the people actually doing the work - they're the ones who'll make or break this whole thing.
Work backwards from what you're actually trying to achieve. Map each metric to a real goal - like if customer churn is the problem, track defect rates and how fast you fix stuff, not some random quality score. Teams always get distracted by vanity metrics that look impressive but don't mean anything. Make sure everyone knows how their daily work connects to the big picture. Pick 3-5 metrics that actually move things forward. Don't try tracking everything - you'll just drown in data. Check in quarterly and ditch what isn't helping. Honestly, most companies track way too much and act on way too little.
Dude, you've got options beyond basic dashboards! Tableau and Power BI are solid for live data visualization - way better than static reports. Process mining tools will show you exactly where things are getting stuck, which is honestly pretty eye-opening. I'm totally into predictive stuff right now, like Qlik Sense can spot trends before they become problems. Mobile apps changed everything for us since people can just punch in metrics right there on the floor. Don't go crazy though - pick one tool that fixes your worst headache first, then expand once you figure out what actually works for your team.
Check your quality KPIs monthly if possible, but quarterly at the bare minimum. Quality problems pop up fast - like, what mattered in January might be totally irrelevant by April. Monthly reviews let you catch shifts before they become major headaches. I can't tell you how many times I've seen teams clinging to metrics that stopped being useful ages ago. Get your team together regularly and ask the obvious question: "Are we still measuring the right stuff?" If a KPI isn't actually changing how people work or improving results, just drop it. Find something that will.
Training your people makes a massive difference with quality KPIs. When teams actually get what they're measuring and why, they'll use those metrics to genuinely improve stuff instead of just checking boxes. I've watched so many places where people either completely ignore the numbers or - this is the worst part - they manipulate them to look good while real problems stay hidden. Your team needs to see how their daily work ties into those key quality metrics. Otherwise you're basically flying blind. Short version: trained people don't game the system, they actually fix things.
Mix your hard numbers with the story behind them - like if you're tracking defect rates, pull in customer feedback themes or dig into what's actually causing problems. Some teams get pretty clever here. They'll weight satisfaction scores using sentiment from comments, or set up "risk flags" when surveys show brewing issues the data hasn't caught yet. The trick is actually organizing your qualitative stuff so it can influence metrics instead of just... existing somewhere in a random doc. Make composite scores or add context layers to your KPIs. Otherwise you're missing half the picture, honestly.
Check out what other companies in your space are doing first - gives you a reality check on what's actually possible. Your own past data matters too since it shows where you're starting from. ASQ and industry groups publish performance stats that are pretty solid (though sometimes buried in reports). I always peek at high performers in similar industries for inspiration. Honestly, industry averages are fine as a baseline. Then aim about 10-15% higher than where you are now - pushes your team without making them want to quit.
Start with workshops to get everyone together - patients, staff, managers, the whole crew. They need to tell you what quality actually looks like in practice. Honestly, I've watched so many metrics die because some exec created them without asking the people who'd actually use them. Let your stakeholders pick the pain points and set targets that make sense. Don't just dump KPIs on them later. Bring them into regular check-ins once things are running. The whole point is getting them to own these metrics instead of feeling like you're just monitoring them from above.
Dude, automation for KPI tracking is seriously worth it. Real-time dashboards pull data straight from your systems and calculate everything automatically - defect rates, customer satisfaction, whatever you need. No more drowning in Excel hell, which honestly sounds like my personal nightmare. You'll get way better accuracy too since there's less chance for mistakes. Plus alerts pop up when metrics go sideways so you can actually fix issues instead of just measuring them. I'd start with whatever KPIs currently take you forever to track manually. Those are gonna give you the biggest time savings right off the bat.
Honestly, people won't change unless they actually give a damn about your KPIs. Connect them to stuff your team already cares about - happy customers, easier workdays, whatever. Post the numbers somewhere everyone can see and update them regularly. Simple metrics work way better than complicated ones (learned this the hard way). When things improve, celebrate it! And when they don't? Don't turn it into a blame fest - just figure out what went wrong. Oh, and if your metrics feel totally disconnected from day-to-day reality, people will tune them out completely.
Keep it simple with your KPI stuff - visual dashboards that update automatically work way better than making people hunt through spreadsheets. Tell the actual story behind your numbers too. I've watched teams drown in data they don't even understand, which is honestly just painful to see. Pick maybe 3-4 key metrics instead of bombarding everyone with everything you can possibly measure. Regular check-ins help, but talk about trends and what's next, not just "here's where we're at today." Oh, and make sure the updates are consistent - people tune out when the format keeps changing.
-
Thanks for all your great templates they have saved me lots of time and accelerate my presentations. Great product, keep them up!
-
“I required a slide for a board meeting and was so satisfied with the final result !! So much went into designing the slide and the communication was amazing! Can’t wait to have my next slide!”