


Retail Store Data Inventory Dashboard




Try Before you Buy Download Free Sample Product
 Impress Your
 Audience
 100%
100% Editable
 Save Hours
 of Time


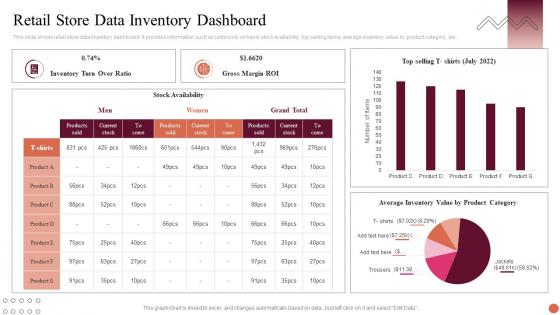
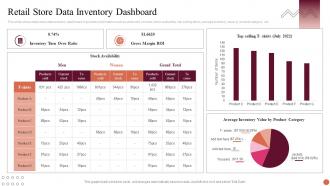
This slide shows retail store data inventory dashboard. It provides information such as units sold, on hand, stock availability, top selling items, average inventory value by product category, etc.
People who downloaded this PowerPoint presentation also viewed the following :
Retail Store Data Inventory Dashboard with all 7 slides:
Use our Retail Store Data Inventory Dashboard to effectively help you save your valuable time. They are readymade to fit into any presentation structure.





FAQs for Retail Store
Honestly, start with stock levels and turnover rates - that's your bread and butter. Track how many days of inventory you've got left and how often you're running out of stuff. Some products just sit there forever, I swear. Fast movers vs slow movers will tell you everything. Gross margins by category matter too, plus reorder points and seasonal patterns. Real-time visibility beats whatever your system claims is happening. Those dusty items in the back corner? Yeah, your reports need to catch that. Get comfortable with these basics first, then you can pile on fancier metrics later.
Dude, real-time integration is a game changer - you'll actually see what's happening NOW instead of staring at yesterday's mess. Your POS, warehouse stuff, and suppliers all feed data straight to your dashboard. No more waiting for those awful quarterly audits to find problems. You can catch theft right away, see which items are flying off shelves, and avoid those "oh crap we're out" moments. The trick? Get all your systems actually talking to each other. Yes, even that ancient one from 2003 that barely works but somehow runs half your business. Figure out what's not connected yet and start there.
Think of forecasting as the part that actually makes your inventory dashboard useful. Your historical data shows what already happened - cool, but now what? The forecasting piece analyzes all that seasonality and demand stuff to predict when you'll run out of stock, what your reorder points should be, which products are gonna sit there collecting dust. Honestly, the forecasted metrics are way more valuable than current numbers for making real decisions. It's like having a heads up instead of just staring at yesterday's news. Pay attention to those predictions - that's where you'll find what you actually need to act on.
Look, a good inventory dashboard basically saves your ass by showing what's actually happening with your stock in real time. You can see which products are collecting dust and which ones are selling like crazy. It tracks your sales speed, when to reorder stuff, and seasonal patterns - all that nerdy data that actually matters for buying decisions. No more playing the guessing game or going with your gut (though honestly, sometimes gut instincts aren't terrible). Set up alerts for low stock and catch overstocked items before they become a headache. Start with your best-selling 20% of products first.
Honestly, bar charts are your best bet for comparing turnover across different products or time periods. You can instantly see what's flying off shelves vs. what's collecting dust. Line charts work really well too if you want to track trends - like did that big sale actually boost your numbers? Heat maps are solid when you're drowning in SKUs since the color coding makes it obvious which ones are winners. I'd probably start simple with a bar chart of your main categories first, then get fancy later if you need to.
So basically, these dashboards show you what's actually selling vs what's just sitting there taking up space. You can see seasonal patterns, supplier reliability, lead times - all that good stuff in one place instead of digging through spreadsheets for hours (been there, done that). It'll flag potential stockouts before you're scrambling to reorder. The real power though? Walk into your next supplier meeting with actual data on their performance. You can optimize reorder points, cut carrying costs, and honestly just make way better decisions. Trust me, once you start using real-time inventory insights, you won't go back to guessing.
So first, figure out what's actually killing you inventory-wise. Overstocking? Focus on slow-moving alerts and turnover rates. Stockouts driving you crazy? Set up low-stock warnings and demand forecasting. Most dashboards now let you drag and drop whatever metrics you want - honestly way better than those cookie-cutter setups. You can make different views too, like buyers see demand trends while warehouse people see fulfillment stuff. I'd start with your top 3 biggest headaches and build from there. Way more useful than trying to track everything at once.
Honestly, cloud dashboards are a game changer for inventory stuff. You can check everything from your phone while you're out, which is super convenient. No dealing with server headaches or updates - they handle all that boring tech maintenance. Your whole team sees the same live numbers too, so no more "wait, which version are we looking at?" confusion. They grow with your business automatically, which is nice since you won't suddenly hit some random limit. I'm probably biased because I love anything that makes decisions faster, but seriously - grab a free trial and see how much smoother things get.
Your dashboard numbers are gonna jump around like crazy based on seasons. During holidays, inventory flies off the shelves so turnover spikes while days of supply drops fast. Stock-outs happen right before big shopping periods - honestly feels like Groundhog Day sometimes. You need different reorder points for busy vs slow times, otherwise you'll have way too much inventory sitting around in January or be totally scrambled restocking for Black Friday. Oh, and set up seasonal filters so you're actually comparing similar time periods when you analyze stuff.
Definitely focus on low stock and overstock alerts first - those will save your butt daily. Stockout notifications are crucial too because discovering you're out of inventory from pissed off customers is the worst. I'd add expiration date warnings and sudden demand spike alerts since weird sales patterns can blindside you. Your purchasing team needs automated reorder point notifications so they know when to pull the trigger on orders. Oh, and make sure every alert tells people what to DO about it. Nobody wants vague "something's broken" messages cluttering their inbox all day.
Honestly, if people can't figure out your dashboard, they just won't use it. Your team needs to spot low inventory and stock trends fast - not waste time clicking through weird menus trying to find basic info. Clean, simple design means they'll actually check it regularly instead of avoiding it. I'd test your current setup with real users first though. Ask them what's confusing or feels off. When staff can trust what they're seeing and find things quickly, they catch problems way earlier. Makes such a difference for decision-making too.
Honestly, if you're just getting started, try Google Data Studio first - it's free and way better than you'd expect. Tableau and Power BI are the gold standard but they'll cost you. I've actually seen people do some pretty slick stuff in Excel, though it gets ugly fast with tons of data. Figure out what metrics you really need first - like, actually write them down. Then there's retail-specific stuff like TradeGecko or inFlow that have dashboards baked in. Looker's solid too but pricier. Really depends on your budget and how complex your data is. Don't overthink it though.
Hey! So basically your team stops running around like crazy looking for stuff when they can just check the dashboard. Real-time stock info means no more disappointing customers about out-of-stock items. Staff can see what needs restocking right away and actually prioritize based on facts, not random guesses. Managers spot patterns super fast - like why do size 8 shoes disappear instantly? (seriously though, what's up with that size). Just make sure people actually use it daily or it's pointless. Maybe do quick morning check-ins with the data.
First thing - set up role-based permissions so not everyone can see profit margins and supplier costs. Use encrypted connections and don't let sensitive stuff cache locally. Stock quantities are actually super risky to display because inventory theft happens way more than you'd think. I'd mask or aggregate the really sensitive numbers. Audit who's looking at what data, and honestly? Set up alerts for weird access patterns. Nobody wants to be the person explaining a data breach to their boss - been there, not fun.
Dude, get everyone looking at the same screen basically. Your sales team won't be selling stuff that's already gone if they can see what purchasing sees in real time. No more of that annoying back-and-forth between departments - they all get the same inventory numbers, shipping updates, how fast things are moving. Honestly saved my ass so many times. Set up alerts when stock gets low so warehouse and procurement both know at once. Oh and customize what each team sees so they're not drowning in random data they don't need.
-
Happy to found you SlideTeam. You guys are value for money. Amazing slides.
-
Amazing variety of PowerPoint slides. Really helpful in designing professional presentations.