

Einnahmenbudget Powerpoint-Präsentationsfolien






Try Before you Buy Download Free Sample Product
 Impress Your
Audience
 100%
Editable
 Save Hours
of Time


Einführung in PowerPoint-Präsentationsfolien mit Einnahmenbudget, die inhaltsfertige professionelle Designs enthalten. Der Umsatz ist das Einkommen, das Unternehmen durch den Verkauf ihrer Waren und Dienstleistungen erzielen. Durch die Verwendung dieses PowerPoint-Komplettpakets für den Einkommensplan können Sie präsentieren, wie Sie die langfristige Rentabilität Ihres Unternehmens berechnen. Dieses PowerPoint-Design für Geldmanagement enthält professionelle Folien zu Budgetvorlagen, Channel-Marketingbudget, Plan-/Ist-Kostenvergleich, Budgetplan für Produkteinführungen, Unternehmensbudget, Veranstaltungsbudget, Marketingbudget für Produkteinführung, Budget für soziale Medien usw. Unsere Forscher untersuchen die Themen gründlich und deckte alle Aspekte der Kapitalplanung ab. Das PPT-Layout des Finanzberichts hilft bei der Darstellung verschiedener verwandter Begriffe wie Kostenanalyse, Kapitalstruktur, Finanzmanagement, Cashflow, Budgetplanung, Umsatzprognose, Rentabilitätsindex, Kapitalmanagement, Finanzplan, Finanzierungsquellen usw. Laden Sie unsere maßgeschneiderte PowerPoint-Vorlage für die Barzuweisung herunter finanzielle Faktoren eindrucksvoll darzustellen. Analysieren Sie widersprüchliche Eingaben mit unseren Powerpoint-Präsentationsfolien zum Einnahmenbudget. Stellen Sie sicher, dass die gezogenen Schlussfolgerungen korrekt sind.
People who downloaded this PowerPoint presentation also viewed the following :
Inhalt dieser Powerpoint-Präsentation
Folie 1 : Diese Folie zeigt das Einnahmenbudget. Geben Sie hier Ihren Firmennamen an und beginnen Sie.
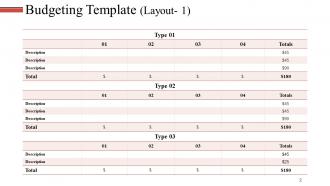
Folie 2 : Dies ist die Folie der Budgetierungsvorlage. Verwenden Sie es, um Ihr Budget zu präsentieren.
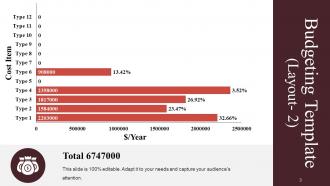
Folie 3 : Diese Folie zeigt auch die Budgetierungsvorlage in Form eines Balkendiagramms/Diagramms.
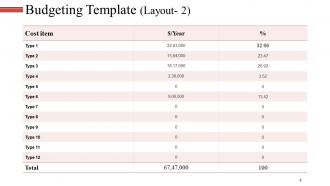
Folie 4 : Dies ist eine weitere Folie, die die Budgetierungsvorlage in tabellarischer Form zeigt.
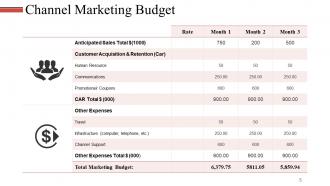
Folie 5 : Diese Folie zeigt das Channel-Marketing-Budget in tabellarischer Form.
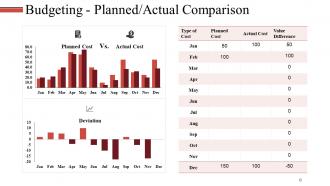
Folie 6 : Dies ist die Budgetierung – Plan-/Ist-Vergleichsfolie in Form eines Balkendiagramms/Diagramms.
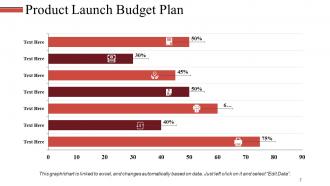
Folie 7 : Diese Folie zeigt den Budgetplan für die Produkteinführung in Form eines Balkendiagramms/Diagramms.
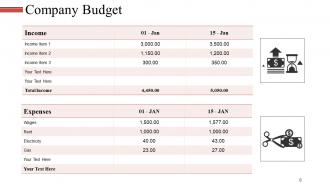
Folie 8 : Diese Folie präsentiert das Unternehmensbudget in tabellarischer Form.
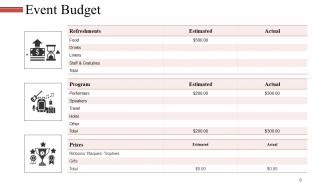
Folie 9 : Dies ist die Veranstaltungsbudget-Folie zur Darstellung.
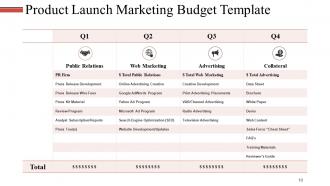
Folie 10 : Diese Folie zeigt die Vorlage für das Marketingbudget für Produkteinführungen in tabellarischer Form.
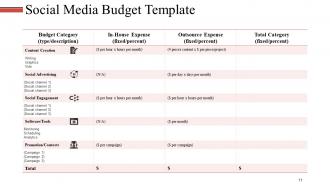
Folie 11 : Diese Folie zeigt die Budgetvorlage für soziale Medien in tabellarischer Form. Verwenden Sie es, um Ihr eigenes Social-Media-Budget anzuzeigen.
Folie 12 : Dies ist die Symbolfolie für das Einnahmenbudget. Verwenden Sie / fügen Sie Symbole nach Ihren Anforderungen hinzu.
Folie 13 : Diese Folie zeigt das Bild der Kaffeepause. Sie können den Inhalt nach Bedarf ändern.
Folie 14 : Diese Folie trägt den Titel Charts & Graphs, um vorwärts zu gehen. Sie können es nach Bedarf ändern.
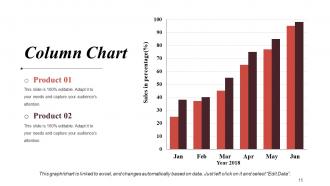
Folie 15 : Dies ist eine Säulendiagrammfolie für den Produkt-/Entitätsvergleich.
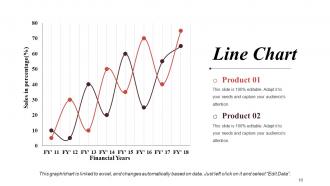
Folie 16 : Dies ist eine Liniendiagrammfolie für den Produkt-/Entitätsvergleich.
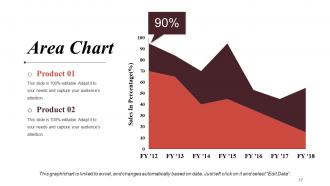
Folie 17 : Dies ist eine Flächendiagrammfolie für den Produkt-/Entitätsvergleich.
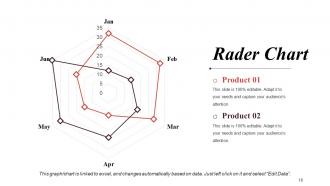
Folie 18 : Dies ist eine Radardiagrammfolie für den Produkt-/Entitätsvergleich.
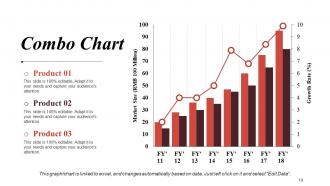
Folie 19 : Dies ist eine Kombinationsdiagramm-Folie zum Präsentieren von Produkt-/Entitätsvergleichen, Spezifikationen usw.
Folie 20 : Diese Folie trägt den Titel Zusätzliche Folien. Sie können den Folieninhalt nach Ihren Wünschen ändern.
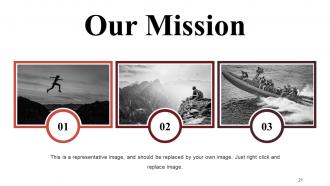
Folie 21 : Diese Folie enthält Unsere Mission mit Textfeldern.
Folie 22 : Dies ist eine Über uns-Folie. Geben Sie hier Firmen- oder Teamspezifikationen an.
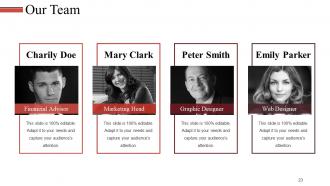
Folie 23 : Diese Folie präsentiert unser Team mit Namen, Bezeichnung und Bildfeld.
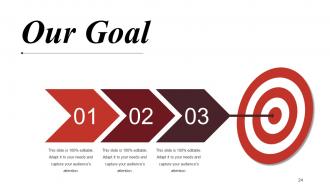
Folie 24 : Diese Folie zeigt Unser Ziel. Geben Sie hier Ihre Ziele an.
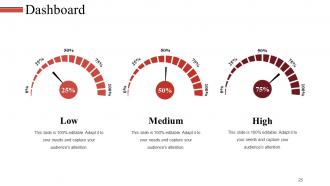
Folie 25 : Diese Folie präsentiert das Dashboard mit niedrigen, mittleren und hohen Parametern.
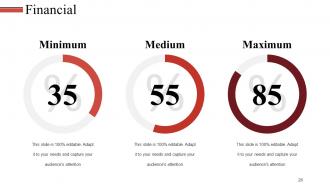
Folie 26 : Diese Folie zeigt die anzuzeigenden Finanzergebnisse.
Folie 27 : Dies ist eine Zitate-Folie, um Botschaften, Überzeugungen usw. zu vermitteln.
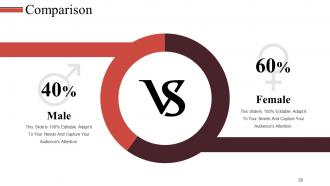
Folie 28 : Dies ist eine Vergleichsfolie, um den Vergleich zweier Entitäten zu zeigen.
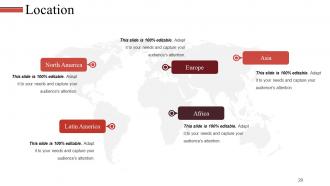
Folie 29 : Dies ist eine Standortfolie, um das globale Wachstum, die Präsenz usw. auf einem Weltkartenbild zu zeigen.
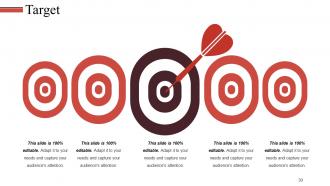
Folie 30 : Diese Folie zeigt das Zielbild mit Textfeldern
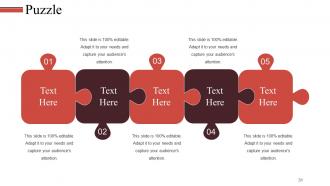
Folie 31 : Dies ist eine Puzzle-Bildfolie, um Informationen, Spezifikationen usw. anzuzeigen.
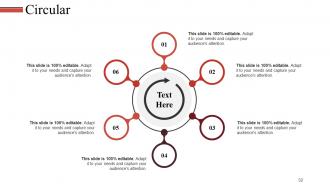
Folie 32 : Dies ist eine kreisförmige Bildfolie. Zustandsinformationen, Spezifikationen etc. hier.
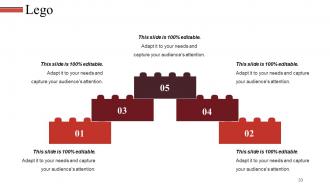
Folie 33 : Dies ist eine Lego-Bildfolie zur Anzeige von Informationen, Spezifikationen usw.
Folie 34 : Dies ist eine Silhouetten-Folie, um personenbezogene Informationen, Spezifikationen usw. anzuzeigen.
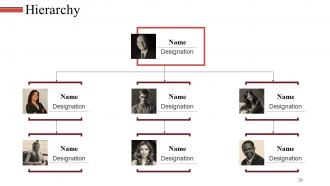
Folie 35 : Dies ist eine Hierarchiefolie, um Informationen, strukturelle Spezifikationen der Organisation usw. anzuzeigen.
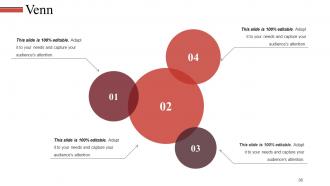
Folie 36 : Dies ist eine Venn-Diagramm-Bildfolie zur Anzeige von Informationen, Spezifikationen usw.
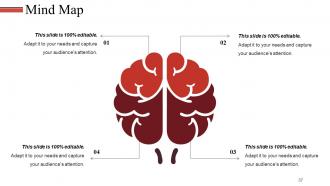
Folie 37 : Dies ist eine Mindmap-Bildfolie zur Anzeige von Informationen, Spezifikationen usw.
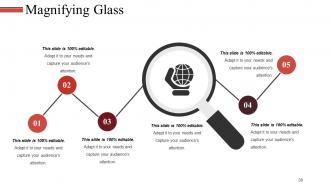
Folie 38 : Dies ist eine Lupenbildfolie zur Anzeige von Informationen, Spezifikationen usw.
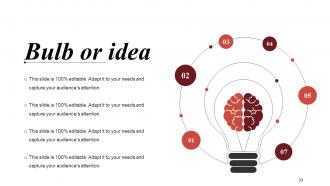
Folie 39 : Dies ist eine Glühbirnen- oder Ideen-Bildfolie, um Ideen, innovative Informationen usw. zu zeigen.
Folie 40 : Dies ist eine Dankesfolie mit Adresse# Hausnummer, Stadt, Bundesland, Kontaktnummern, E-Mail-Adresse.
Umsatzbudget-Powerpoint-Präsentationsfolien mit allen 40 Folien:
Implementieren Sie die Übung mit unseren Powerpoint-Präsentationsfolien für das Einnahmenbudget. Führen Sie die Leute durch die Notfallmaßnahmen.







FAQs for Revenue Budget
Look, a revenue budget is basically your best guess at how much money you'll make over the next year or whatever timeframe. You're setting sales targets and figuring out where to spend your cash - hiring, marketing, all that stuff. Without one, you're just winging it and have no clue if things are actually going well or if you're delusional about your progress. Honestly, I've seen too many businesses crash because they never bothered with this step. Start with your past sales numbers if you have them, then factor in market trends. It's not rocket science, but it'll save your butt later.
Revenue budget is your day-to-day stuff - salaries, rent, utilities, office supplies. Basically what keeps everything running month to month. Capital budget? That's the expensive equipment and upgrades you'll be using for years. Simple rule I use: gone within a year = revenue expense. Still using it in three years = capital. My old boss was obsessed with this distinction (probably because accounting gets mad when you mix them up). But honestly, it does matter since they affect your books totally differently. Just keep them separate when you're planning!
Start with your sales forecasts - break those down by product lines and customer segments. Historical data is your best friend here. Don't forget to account for returns and discounts because they'll bite you later if you ignore them. I always do three scenarios: realistic, best-case, and the inevitable worst-case that keeps me up at night. Seasonal trends matter too, depending on your business. Pricing strategy changes can throw everything off, so factor those in. The trick is finding that sweet spot where you're detailed enough to actually track performance but not drowning in spreadsheet hell every week.
Honestly, I'd start with your last 2-3 years of sales data - seasonal stuff really matters there. Then think about what's actually changing this year: new products, market shifts, pricing tweaks, whatever. Your sales team's pipeline is gold for this too, plus whatever marketing's saying about leads coming in. Don't go crazy optimistic though - that big client deal might not happen, you know? I'm always a bit conservative with these forecasts because stuff changes fast. Build in some cushion and then just tweak it monthly when real numbers come in.
Look, your old sales numbers are gold for building budgets. They'll show you seasonal patterns and what's actually doable - not just pipe dreams. Nobody wants to be that guy projecting 500% growth because Mercury's in retrograde or whatever. Pull at least 2-3 years of data to spot the real trends. See which months tank and which ones crush it. Those patterns become your baseline. But don't just photocopy last year's sheet though. Markets shift, competition changes, maybe you launched something new. Take those historical trends and tweak them based on what's happening now in your space.
External economic factors can completely mess with your revenue budget - stuff like inflation, interest rates, unemployment rates. You can't control any of it but you definitely have to account for it. Currency fluctuations are brutal if you're doing international business. GDP growth impacts everything too. It's honestly frustrating sometimes because you're basically shooting at a moving target. Build flexibility into your assumptions though. Monitor the key indicators regularly so you can adjust fast when things change. Oh, and customer spending habits shift with interest rates way more than people realize.
Honestly, start by digging into your current revenue streams - that's where the gold is. Upselling and cross-selling to existing customers is your best bet since acquiring new ones costs a fortune. Pricing tweaks can be surprisingly effective too. Market expansion and new product lines are solid moves, but don't bite off more than you can chew. I'd also look at streamlining your sales process - sometimes it's just inefficient workflows killing your numbers. Pick maybe 2-3 strategies max that'll give you the biggest bang for your buck. Being ambitious is great, but you've gotta be realistic about execution too.
Check your revenue budget monthly, bare minimum. Quarterly deep dives are pretty much the norm. Those monthly check-ins help you catch trends early - way better than scrambling at year-end when you're already screwed. I've watched teams do exactly that and it's painful. The quarterly stuff is where you actually dig in: analyze what went wrong, update forecasts, tweak your approach. Seasonal business? You might need to look even more often. Honestly, just set those calendar reminders right now or you'll definitely forget.
Honestly, forecasting is a nightmare - you're basically trying to predict the future, which is impossible. Getting good data is another headache since sales teams are always super optimistic while finance wants to be cautious about everything. Seasonal stuff will mess you up too, especially in retail. Market conditions shift constantly and customer behavior changes overnight. Oh, and I learned this the hard way - don't try to get it perfect from day one. Build in some wiggle room with different scenarios and just update your assumptions every few months instead.
Honestly, tech can be a game changer for revenue budgeting. Forecasting software beats the hell out of Excel for analyzing past data and predicting trends. Your CRM already tracks pipeline stuff and conversion rates - that's goldmine data right there. Automated reporting pulls everything together in real time, which saves me like 3 hours every week (no joke). Cloud platforms let everyone jump in and update forecasts instantly too. I'd say start by figuring out what manual stuff drives you crazy, then find tools that handle those specific headaches. Way less painful than doing it all by hand.
Pricing is literally everything for your revenue budget. Set it too low? You'll sell tons but make no money. Too high and customers just walk away - learned that the hard way once. Finding the right price point is tricky but crucial. You need something that matches what people actually want to pay while hitting your revenue goals. Honestly, I'd play around with different pricing scenarios in your budget model. See how much your revenue changes when you tweak prices up or down. That'll show you just how sensitive everything really is.
Yeah, revenue budgets are totally different depending on your industry. SaaS companies have that sweet recurring revenue that's pretty easy to predict, but restaurants? Good luck with that - way more unpredictable. Manufacturing gets weird because of long lead times and when you actually recognize the revenue. Retail has to deal with seasonal stuff and inventory cycles. Service businesses usually see money come in faster but it's harder to forecast. Honestly, the biggest mistake I see is people just copying budget templates from random industries. You really need to figure out your specific patterns first - like when money actually comes in versus when you earn it.
Here's the thing - booking revenue and actually getting paid are completely different beasts. Say you invoice $100k this month but customers take 60 days to pay. That money won't hit your account until way later, which honestly trips up so many business owners. Seasonal stuff matters too - like if everyone pays slow around holidays. Bad debt is another fun surprise waiting to happen. My advice? Run a separate cash flow forecast alongside your revenue projections. Trust me, you don't want to be scrambling when the bills are due but your "revenue" is still sitting in receivables.
Honestly, just focus on tracking your budgeted vs actual revenue - that's your bread and butter metric. Check it monthly and break it down by product lines or regions to catch any weird patterns. Being within 10-15% is actually pretty decent for most businesses, so don't stress if you're not perfect. Pipeline health and conversion rates are super helpful too since they give you a heads up on what's coming. Oh, and customer acquisition costs - those matter more than people think. Set up some kind of dashboard that pulls this stuff automatically. Trust me, you don't want to be doing manual calculations every month like I used to.
Look, your revenue budget is honestly the most important thing for your company's financial health. Hit those targets consistently? You're golden - shows you've got solid market positioning and your sales team knows what they're doing. But miss them regularly and everything starts falling apart. Cash flow gets messy, you can't invest in growth, sometimes people lose jobs. Investors always check this first too. I learned this the hard way at my last job - we kept missing targets and management just ignored it until things got really bad. Use it like a warning system. If you're consistently off, something's wrong with your strategy.
-
Very unique, user-friendly presentation interface.
-
Commendable slides with attractive designs. Extremely pleased with the fact that they are easy to modify. Great work!