


Risk table risk analysis simplified format




Try Before you Buy Download Free Sample Product
 Impress Your
 Audience
 100%
100% Editable
 Save Hours
 of Time


Expose instances of corruption with our Risk Table Risk Analysis Simplified Format. Join forces against bribery.
People who downloaded this PowerPoint presentation also viewed the following :
Content of this Powerpoint Presentation
Description:
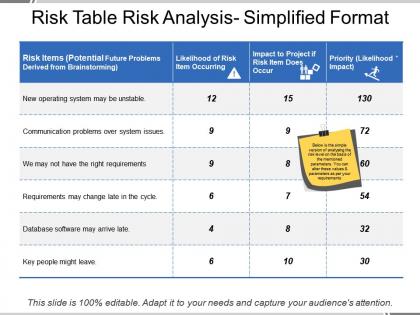
The image features a PowerPoint slide titled "Risk Table Risk Analysis – Simplified Format," which is a tool commonly used in project management to assess and prioritize potential risks. The table is divided into several columns:
1. Risk Items (Potential Future Problems Derived from Brainstorming):
Lists identified potential risks.
2. Likelihood of Risk Item Occurring:
A numerical score indicating how likely each risk is to occur.
3. Impact to Project if Risk Item Does Occur:
A numerical score representing the potential impact on the project if the risk materializes.
4. Priority (Likelihood * Impact):
A calculated score (product of likelihood and impact) that prioritizes the risks, with higher scores indicating higher priority.
A sticky note graphic contains additional information stating: "Below is the simple version of analyzing the risk level based on the mentioned parameters. You can alter these values & parameters as per your requirements."
The slide also states that it is "100% editable," allowing users to customize it according to their specific project needs.
Use Cases:
This risk analysis table can be effectively utilized in various industries for risk management and mitigation planning:
1. Information Technology:
Use: Assessing risks in software development projects.
Presenter: IT Project Manager
Audience: Development Team, Stakeholders
2. Construction:
Use: Prioritizing risks in construction planning.
Presenter: Construction Manager
Audience: Project Team, Investors
3. Healthcare:
Use: Managing risks in healthcare administration and patient care projects.
Presenter: Healthcare Project Manager
Audience: Hospital Administration, Medical Staff
4. Finance:
Use: Evaluating risks in financial product launches or system upgrades.
Presenter: Risk Compliance Officer
Audience: Financial Analysts, Management
5. Manufacturing:
Use: Identifying risks in manufacturing process changes.
Presenter: Operations Manager
Audience: Process Engineers, Quality Assurance Team
6. Event Planning:
Use: Planning for potential disruptions in large-scale events.
Presenter: Event Coordinator
Audience: Vendors, Security Personnel
7. Energy Sector:
Use: Analyzing risks in energy project deployments.
Presenter: Energy Analyst
Audience: Project Engineers, Environmental Regulators
Risk table risk analysis simplified format with all 5 slides:
Set the benchmark with your thoughts. Our Risk Table Risk Analysis Simplified Format will fulfill your criteria.



FAQs for Risk table risk
Key components include risk identification, probability assessment, impact evaluation, risk categorization, mitigation strategies, responsible parties, and timeline for review. These elements work together by providing comprehensive visibility into potential threats, enabling organizations to prioritize resources effectively, develop targeted response plans, and maintain proactive risk management, ultimately delivering enhanced operational resilience and strategic decision-making capabilities.
Accurate risk assessment requires systematic evaluation criteria, standardized scoring methodologies, stakeholder input validation, historical data analysis, and regular calibration reviews. Organizations enhance accuracy by implementing cross-functional assessment teams, utilizing quantitative metrics alongside qualitative insights, and conducting periodic audits of risk predictions versus actual outcomes, ultimately delivering more reliable risk management decisions.
Qualitative risk analysis uses descriptive assessments like "high," "medium," or "low" to categorize risks based on subjective judgment, while quantitative analysis employs numerical data, statistical models, and mathematical calculations to measure risk probability and impact. These complementary approaches enable organizations to create comprehensive risk analysis tables that balance intuitive understanding with data-driven precision, ultimately delivering more strategic decision-making capabilities.
Visual aids enhance risk analysis tables by incorporating color-coded risk levels, heat maps, trend arrows, and interactive elements that make complex data immediately comprehensible. These enhancements enable executives to quickly identify critical risks, prioritize responses, and communicate findings more effectively to stakeholders, while interactive dashboards allow real-time scenario planning, ultimately delivering faster decision-making and improved risk management outcomes.
Risk prioritization strategies include risk scoring matrices, probability-impact assessments, qualitative ranking systems, quantitative modeling, and stakeholder impact evaluations. These approaches enable organizations to systematically categorize threats by severity and likelihood, with many financial institutions and healthcare organizations finding that combining multiple prioritization methods delivers more accurate resource allocation and strategic risk mitigation planning.
Risk analysis tables should be updated quarterly at minimum, with more frequent reviews during periods of significant organizational change, market volatility, or regulatory shifts. Many organizations find that monthly updates work best for dynamic sectors like financial services or healthcare, while stable industries may manage with bi-annual comprehensive reviews, ultimately ensuring risk mitigation strategies remain effective and relevant.
Risk analysis table creation benefits from tools like Microsoft Excel, Tableau, Power BI, GRC platforms such as ServiceNow, and specialized risk management software like LogicGate or MetricStream. These technologies streamline risk identification, automate probability calculations, and enhance visualization capabilities, with many organizations finding that integrated platforms ultimately deliver better risk oversight, faster decision-making, and more comprehensive regulatory compliance across their operations.
Stakeholders can be involved through collaborative risk identification workshops, expert interviews, impact assessment surveys, and validation reviews that feed directly into table entries. Financial teams, operations managers, and department heads provide sector-specific insights on probability ratings and mitigation strategies, while executive sponsors review prioritization rankings, ultimately ensuring comprehensive risk coverage and organizational buy-in across all business units.
Common mistakes include inadequate risk identification, vague probability assessments, unclear impact descriptions, missing risk interdependencies, and insufficient mitigation strategies. Organizations often overlook regular updates, fail to assign clear ownership, or create overly complex matrices that hinder decision-making, ultimately reducing the table's effectiveness in strategic planning and operational risk management.
A risk analysis table informs decision-making by systematically evaluating potential threats, their likelihood, impact severity, and mitigation strategies, enabling leaders to prioritize resource allocation effectively. Through structured risk assessment, organizations in sectors like manufacturing, healthcare, and financial services can make data-driven choices, ultimately minimizing operational disruptions while maximizing strategic opportunities.
Risk analysis tables enhance compliance and regulatory reporting by systematically documenting risk assessments, control measures, mitigation strategies, and monitoring outcomes in standardized formats. These structured frameworks enable organizations to demonstrate due diligence to regulators, streamline audit processes, and maintain comprehensive evidence trails, with financial institutions and healthcare organizations finding that consistent risk documentation significantly reduces compliance costs while ensuring regulatory transparency.
**INPUT**: How can you effectively communicate complex risks in a simple risk analysis table format? **OUTPUT**: Effective risk communication through tables involves using clear categories like probability, impact, mitigation strategies, and ownership assignments, combined with visual indicators such as color coding and standardized rating scales. This approach enables stakeholders across departments to quickly assess priority risks, allocate resources strategically, and make informed decisions, with many organizations finding that simplified formats enhance cross-functional collaboration and accelerate response times. [Word count: 60]
Historical data serves as the foundation for risk analysis tables by providing empirical evidence of past incidents, their frequencies, impact levels, and resolution outcomes. This data enables organizations to identify patterns, calculate probability distributions, and establish baseline risk metrics across sectors like banking, healthcare, and manufacturing, ultimately delivering more accurate risk assessments and strategic mitigation planning.
Scenario analysis integrates into risk analysis tables by adding multiple probability columns for different conditions, incorporating impact variations across best-case, worst-case, and most-likely scenarios, and enabling dynamic risk scoring. This approach allows organizations to model various market conditions, regulatory changes, and operational disruptions within a single framework, ultimately delivering more comprehensive risk assessments and strategic decision-making capabilities.
Financial services, healthcare, manufacturing, construction, and energy sectors benefit most from risk analysis tables due to their complex regulatory environments, high-stakes decision-making, and significant operational hazards. These industries leverage structured risk assessment to streamline compliance processes, enhance strategic planning, and minimize costly disruptions, with many organizations finding that systematic risk documentation ultimately delivers competitive advantage and operational resilience.
-
It saves your time and decrease your efforts in half.
-
Best way of representation of the topic.