


Sales Department Flow Chart Of Business Organization




Try Before you Buy Download Free Sample Product
 Impress Your
 Audience
 100%
100% Editable
 Save Hours
 of Time


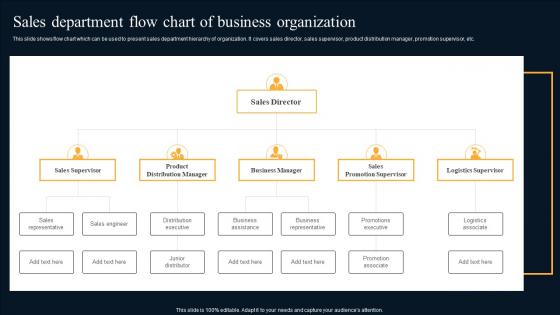
This slide shows flow chart which can be used to present sales department hierarchy of organization. It covers sales director, sales supervisor, product distribution manager, promotion supervisor, etc.
People who downloaded this PowerPoint presentation also viewed the following :
Sales Department Flow Chart Of Business Organization with all 6 slides:
Use our Sales Department Flow Chart Of Business Organization to effectively help you save your valuable time. They are readymade to fit into any presentation structure.





FAQs for Sales Department Flow Chart
Key components include lead generation processes, qualification criteria, sales pipeline stages, customer relationship management touchpoints, and performance tracking metrics. These elements streamline operations by defining clear handoff points, establishing accountability measures, and creating visibility into conversion rates, with many organizations finding that structured workflows reduce sales cycle times and improve forecasting accuracy.
Flow charts help new sales team members visualize the entire sales process by mapping each stage, from lead generation and qualification to closing and follow-up, creating clear pathways and decision points. Through visual representation, organizations streamline onboarding, reduce training time, and ensure consistency across teams, with many sales departments finding that structured process visualization accelerates new hire productivity and improves overall conversion rates.
**INPUT**: What software tools are best suited for creating sales department flow charts? **OUTPUT**: Popular software tools for creating sales department flow charts include Microsoft Visio, Lucidchart, Draw.io, Creately, and SmartDraw, each offering specialized templates and collaborative features. These platforms streamline workflow visualization by providing drag-and-drop functionality, real-time collaboration, and integration capabilities, with many sales teams finding that cloud-based solutions like Lucidchart enhance accessibility and enable seamless updates across departments. *[Word count: 60]*
A well-structured flow chart improves sales team communication by creating visual clarity around processes, roles, and handoffs, eliminating confusion about responsibilities and next steps. Through standardized workflows, sales teams streamline lead management, accelerate deal progression, and enhance collaboration between departments, with many organizations finding that clear process visualization reduces miscommunication and ultimately delivers faster conversions.
Common mistakes include creating overly complex hierarchies, unclear role definitions, missing feedback loops, inadequate lead qualification stages, and poor integration between departments. These design flaws often result in confused responsibilities, inefficient handoffs between sales stages, and missed opportunities, with many organizations finding that streamlined, well-defined processes ultimately enhance team performance and revenue outcomes.
Sales performance metrics can be integrated into flow charts by embedding KPIs at each stage, incorporating decision points based on conversion rates, win/loss ratios, and pipeline velocity, and adding feedback loops for continuous optimization. This approach enables sales teams to visualize bottlenecks, track quota attainment, and identify coaching opportunities in real-time, ultimately streamlining performance management and accelerating revenue growth across the entire sales organization.
Sales funnels serve as the foundational framework for sales department flow charts, defining lead progression stages from initial contact through conversion, nurturing activities, and post-sale management. These structured pathways enable organizations to map departmental workflows, assign role responsibilities at each funnel stage, and streamline handoffs between teams, ultimately delivering improved conversion rates and enhanced customer experiences.
A flow chart facilitates better lead tracking by visualizing each stage progression, defining handoff points between team members, and establishing clear status indicators throughout the sales pipeline. This systematic approach enables sales teams to monitor conversion rates, identify bottlenecks more effectively, and ensure consistent follow-up protocols, ultimately delivering improved lead nurturing and higher conversion rates across the entire sales process.
Flow charts enhance sales onboarding by providing visual step-by-step processes for lead qualification, customer relationship management, proposal development, and closing procedures, while standardizing training across different territories and experience levels. Through structured visual guides, new representatives accelerate their learning curve, reduce errors in sales methodologies, and achieve quota faster, with many organizations finding that systematic onboarding flow charts improve first-year retention rates significantly.
Sales methodologies that translate effectively into flow charts include SPIN Selling, Challenger Sale, MEDDIC qualification, consultative selling, and solution-based approaches. These structured methodologies enhance team alignment and training consistency by mapping decision points, qualification criteria, and progression stages, with many sales organizations finding that visual process documentation significantly improves conversion rates and shortens sales cycles.
Sales department flow charts should be updated quarterly or semi-annually during regular business reviews, with immediate updates following major organizational changes, new product launches, or process modifications. Many organizations find that scheduled reviews coincide with performance assessments and strategic planning cycles, ensuring the flow chart accurately reflects current territories, responsibilities, and workflows while maintaining operational efficiency and clear accountability structures.
Visual elements that should be emphasized in a sales flow chart include clear directional arrows, distinct color coding for different stages, bold decision points with yes/no pathways, consistent shape usage, and prominent milestone markers. These design choices streamline comprehension by creating intuitive navigation, highlighting critical transitions, and enabling quick identification of bottlenecks, with many sales teams finding that well-designed visual hierarchy ultimately delivers faster onboarding and improved process adherence.
Cross-departmental collaboration can be depicted through interconnected process lanes, shared decision points, handoff arrows between departments, and collaborative milestone markers within your sales flow chart. These visual elements streamline communication workflows by clearly mapping touchpoints between sales, marketing, customer service, and operations teams, ultimately delivering enhanced customer experiences and faster deal closure rates.
Color coding in sales department flow charts offers significant advantages including enhanced visual clarity, faster process identification, improved team communication, reduced training time, and streamlined workflow management. These visual distinctions enable sales teams to quickly distinguish between lead qualification stages, approval processes, and departmental handoffs, while minimizing errors and accelerating decision-making, ultimately delivering better operational efficiency and faster customer response times.
Customer feedback loops in sales department flow charts are illustrated through circular pathways connecting post-sale customer interactions back to initial prospecting and lead qualification stages. These visual representations show feedback flowing from customer success teams to sales representatives, from support tickets to product development, and from retention metrics to strategy refinement, with many organizations finding that mapping these continuous cycles enhances customer relationships and drives revenue growth.
-
Great designs, really helpful.
-
“Slides are formally built and the color theme is also very exciting. This went perfectly with my needs and saved a good amount of time.”