Talent Acquisition And Recruitment Analytics Dashboard
Try Before you Buy Download Free Sample Product
Audience
Editable
of Time
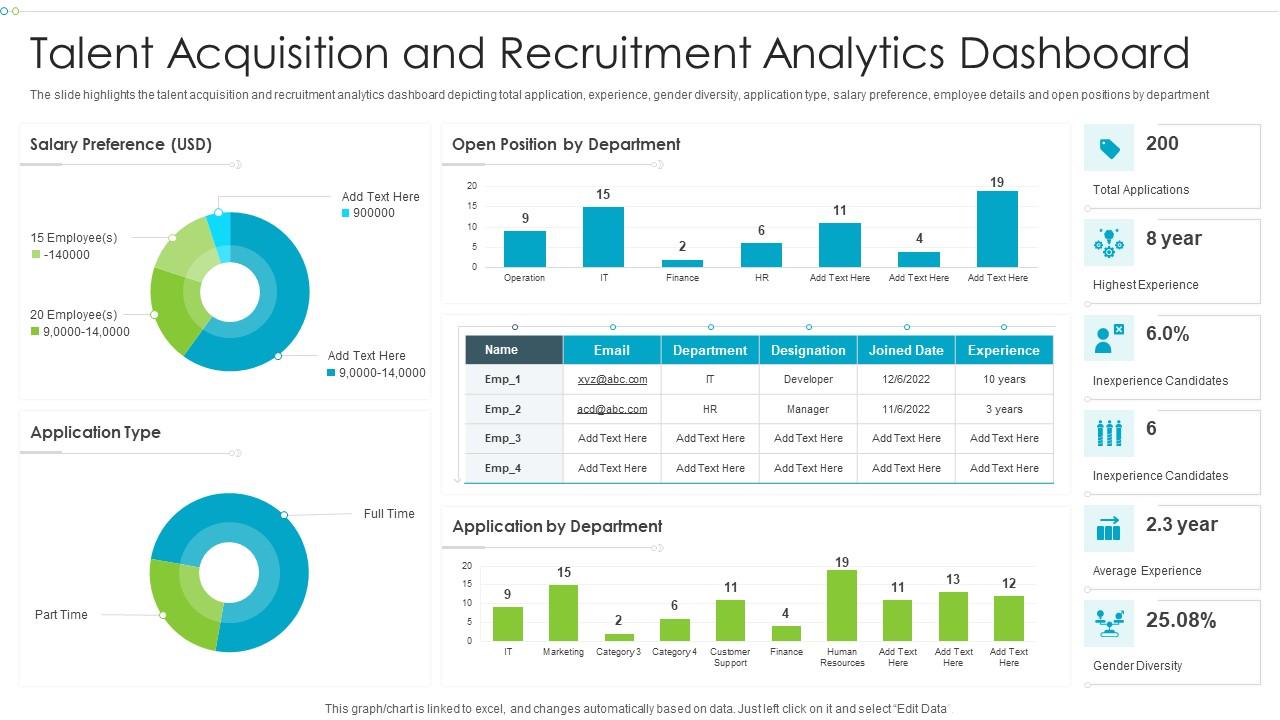
The slide highlights the talent acquisition and recruitment analytics dashboard depicting total application, experience, gender diversity, application type, salary preference, employee details and open positions by department.
People who downloaded this PowerPoint presentation also viewed the following :
Talent Acquisition And Recruitment Analytics Dashboard with all 7 slides:
Use our Talent Acquisition And Recruitment Analytics Dashboard to effectively help you save your valuable time. They are readymade to fit into any presentation structure.
FAQs for Talent Acquisition And
Track time-to-fill, cost-per-hire, and quality-of-hire first. Those are your bread and butter. Source effectiveness matters too - like which job boards actually work vs just drain your budget. Don't bother with total applications though. That's just noise. Offer acceptance rates tell you if you're competitive. Candidate experience scores help too, especially since everyone talks these days. Oh, and definitely include pipeline health and hiring manager satisfaction - trust me on that one. Start with maybe 5-6 metrics max. You can always add more later once you've got the basics down.
Look, data viz is a game changer for recruitment. Raw numbers in spreadsheets? Total nightmare. But throw them into charts and suddenly you're seeing patterns everywhere - seasonal hiring drops, which positions drag on forever, your best candidate sources. Funnel charts show you exactly where people bail in your process. Heat maps reveal which job boards actually work (spoiler: probably not the expensive ones). I started with basic stuff and now I can spot bottlenecks instantly. Plus leadership loves seeing actual visual progress instead of me just saying "trust me, we're doing better."
Honestly, just think about what would make you not hate the hiring process if you were applying somewhere. Track your time-to-hire and response times - nobody's got patience for radio silence these days. Interview scheduling efficiency matters too, plus offer acceptance rates. Feedback scores at each stage will tell you where people are getting frustrated. Oh, and definitely watch dropout rates because that's usually when your process is being annoying. I'd probably start with whatever's making candidates complain the most. Each metric should basically answer: are we being decent to people or not?
Honestly, these dashboards are such a lifesaver for hiring. You get to see your whole pipeline in real-time instead of drowning in random spreadsheets (which I used to hate doing). Track where candidates are dropping off, which job boards actually work, and how slow your interview process really is. The data helps you fix bottlenecks before they become major headaches. My advice? Don't go overboard at first - pick maybe 3 or 4 metrics that are driving you crazy right now. Once your team gets used to checking the numbers regularly, you can add more tracking from there.
Honestly, start with your ATS integration - that's where most of your good data is hiding anyway. Tableau or Power BI are solid choices, but Google Data Studio works fine if you're just getting started. You'll definitely want to connect it to your HRIS and maybe job boards for sourcing stuff. Oh, and learn some basic SQL if you haven't already. The standard reports never give you exactly what you need, so you'll be writing custom queries constantly. Power BI is actually pretty user-friendly once you get the hang of it. Some people add survey tools like Glint for feedback metrics, but I'd focus on the core stuff first.
Dude, real-time data is a game changer for hiring. You can actually see what's happening as it happens instead of getting those useless monthly reports. Like, if candidates keep bailing after interviews, boom - you know something's wrong with your process. Those expensive job boards? Half of them are garbage and you'll spot it immediately when the data shows they're sending you tons of applicants but zero quality. Plus you catch the annoying stuff - like when hiring managers take forever to respond and bottleneck everything. Check your dashboard daily though, otherwise what's the point of having all this fancy tech?
So basically, when you track diversity metrics, you'll spot exactly where diverse candidates are dropping off in your process. Maybe your sourcing is fine but something's weird in interviews - who knows until you look at the data? I actually think the real-time dashboard thing is clutch because you can fix issues fast instead of realizing months later you've been screwing up. Don't go crazy with like 20 different metrics though. Pick 2-3 that matter most and start there. You'll see patterns you never noticed before.
Set it up like a visual flow - applications down to hires with conversion rates between each step. Show both raw numbers and percentages because execs honestly get excited seeing actual candidate counts. Color-code the trouble spots red when conversion rates tank below your benchmarks. Time-to-fill metrics are crucial at every stage, and definitely break it down by department since engineering hiring looks nothing like sales hiring. Oh, and add filters for date ranges and hiring managers - otherwise your team can't dig into what's actually broken and fix it.
Start simple - maybe just predict how long it'll take to fill roles. Your dashboard can show stuff like candidate success scores and who's likely to quit soon. Honestly, the hardest part is having decent historical data to work with (messy data = useless predictions). Once you nail one forecast, add more. I'd focus on predictions that'll actually change what your team does daily, not just fancy numbers that look cool. The whole point is seeing what's coming instead of just reporting what already happened, right?
Ugh, the biggest mistake is cramming every possible metric onto one screen. Nobody wants to stare at that mess. Focus on what actually matters - time-to-fill, which sources are working, pipeline health. That kind of stuff. Static data that updates once a week? Total nightmare when you're tracking fast roles. Your dashboard should tell a story, not just dump random numbers everywhere. Oh, and definitely test it with real recruiters first! I've seen too many dashboards built in a vacuum that nobody ends up using. Start small - maybe 5-7 key metrics, get feedback, then build from there.
Honestly, hiring manager feedback is everything for your dashboard. When they keep complaining about candidate quality, that's your cue to track different stuff - maybe which sourcing channels actually work for technical roles or quality metrics instead of just speed. The worst is when your numbers look amazing but they're still unhappy, you know? Like your time-to-fill is great but they hate everyone you're sending. Without their input, you're basically staring at meaningless data. Set up monthly coffee chats or whatever works to figure out what they actually care about, then tweak your metrics accordingly.
Looking at your hiring data over time is honestly a game changer. You'll catch seasonal patterns - like how tech roles always spike in January for some reason. Plus you can see which job boards actually send decent candidates versus the ones that just waste your budget. Time-to-fill trends show if you're getting faster or slower (spoiler: it's usually slower). Cost-per-hire changes tell you if you're spending smarter or just bleeding money. Some roles are always gonna take forever - that's just reality. But this stuff helps you plan better and stop making the same mistakes over and over.
Daily is ideal, but honestly every few days works too. Weekly is pushing it though - any less and you're gonna miss stuff. We learned this lesson when our dashboard only updated monthly and totally missed some hiring bottlenecks. Not fun explaining that to leadership! Daily checks help you spot problems early, like when applications randomly tank or roles get stuck somewhere in your process. If you can automate the data pulls, do it. Otherwise just block out 15 minutes each morning to refresh everything manually. Takes no time but saves you headaches later.
Look, your employer brand totally changes what metrics you should actually care about. Strong brands need to focus on quality stuff - offer acceptance rates, how long senior roles take to fill, candidate satisfaction. Volume metrics? Meh, not as useful. Source quality becomes way more important since good branding should pull in better candidates naturally. Track your brand perception data and employee referrals too. Those really show if your branding efforts are paying off or just burning budget. Oh, and definitely add a section tracking where your best hires come from. You'll want to double down on whatever's working there.
Just show people what they actually need, not everything at once. Recruiters want the nitty-gritty stuff - pipeline health, time-to-fill, how well different sourcing channels work. Execs? They're looking at bigger picture things like cost-per-hire and diversity metrics. Honestly, dumping all the data on everyone just makes their eyes glaze over. Set up different permission levels so each group sees their relevant stuff. My advice is to literally ask them what decisions they're trying to make first - saves you from building dashboards nobody uses.
-
Huge collection of high-quality templates. Worth each penny.Â
-
Based on my personal experience, I would recommend other people to subscribe to SlideTeam. No one can be disappointed here!