


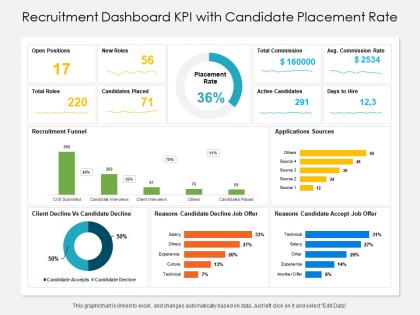
Recruitment dashboard kpi with candidate placement rate





Try Before you Buy Download Free Sample Product
 Impress Your
 Audience
 100%
100% Editable
 Save Hours
 of Time


Our Recruitment Dashboard KPI With Candidate Placement Rate are topically designed to provide an attractive backdrop to any subject. Use them to look like a presentation pro.
People who downloaded this PowerPoint presentation also viewed the following :
Recruitment dashboard kpi with candidate placement rate with all 2 slides:
Use our Recruitment Dashboard KPI With Candidate Placement Rate to effectively help you save your valuable time. They are readymade to fit into any presentation structure.
FAQs for Recruitment dashboard kpi with
Track time-to-fill, cost-per-hire, and quality-of-hire first - those three are your bread and butter. Time-to-fill shows if your process is dragging. Cost-per-hire keeps your budget in check. Quality-of-hire is honestly the hardest one to nail down, but look at 90-day retention and how new hires perform in reviews. Also throw in source effectiveness so you know if that expensive job board is actually worth it. Candidate experience scores are clutch too, especially when everyone's fighting for talent. Start there and you'll be golden.
Here's the thing - dragging out your hiring process means losing good people to faster companies. Your current team gets burned out picking up slack too. But if you rush? You'll probably make terrible hires that'll bite you later (learned this the hard way). Look at where candidates actually bail in your process. Slow scheduling? Too many people need to approve everything? Map that stuff out first. Different roles will have different timelines, so track those separately. The goal isn't speed - it's cutting out the pointless delays while still properly vetting people.
Look, candidate quality is everything - without it, your other metrics are just pretty numbers that don't mean much. Sure, you might be hitting fast time-to-hire goals, but if those people bomb out or quit in three months? That's not a win. I've seen companies get obsessed with speed and totally ignore whether they're actually hiring decent people. Quality hits your retention, keeps managers happy, and honestly just makes your job easier long-term. Track stuff like 90-day performance reviews alongside your speed metrics - you'll get a way better picture of what's actually working.
So source of hire data shows which recruiting channels actually bring in good hires - not just tons of applications, but people who get the job AND stay. Track if LinkedIn, job boards, referrals, or recruiters give you quality candidates with better ROI. Honestly, it's wild when you see you're blowing money on channels that barely work while some random cheap one is killing it. I'd reallocate budget toward what's working and completely dump the dead weight channels. Sometimes the obvious expensive option isn't even close to the best performer.
So offer acceptance rate is basically your closing percentage - shows how appealing your job offers really are. You want to hit around 80-90% (though this shifts depending on industry). Low rates? Usually means your pay sucks, the interview process was brutal, or someone else swooped in with a better deal. Cold feet happens too but not as much as you'd think. Track it with your other hiring metrics like time-to-fill. If it suddenly tanks, definitely call up those recent rejects and ask what went wrong - you'll learn way more than just guessing.
Dude, your ATS is going to save you so much time on tracking stuff. Everything gets logged automatically - time-to-fill, which job boards actually work, conversion rates, cost-per-hire. No more spreadsheet hell! The dashboard reports look pretty slick too, which honestly helps when you're presenting to leadership. Here's the thing though - tons of people set up their ATS and completely ignore the analytics section. That's where all the juicy insights are hiding. Since everything runs through one system, your data stays clean and you don't have to worry about inconsistencies messing up your numbers.
Track your candidate NPS and how fast you're getting back to people - response time is everything. Nobody wants to sit in interview limbo for weeks. Also measure completion rates and where candidates are dropping off, because frustrated people just ghost instead of telling you what's wrong. Survey them after each step about communication, scheduling, the whole deal. Honestly, reading those survey comments is where you'll find the real issues. Don't forget offer acceptance rates either - if people are turning you down, your process might be the problem.
Honestly, diversity hiring is worth it long-term even if it slows you down at first. Your retention gets way better, and people are actually happier at work. Plus your company looks more attractive to candidates - which is huge right now. Time-to-hire might drag initially since you're casting a wider net, but the quality improves. The culture shift is probably the biggest win though. Teams just think differently when they're not all the same background, you know? Way less groupthink and more creative solutions. Just make sure you're tracking diversity numbers alongside your usual metrics so you can see what's actually working.
Honestly, retention rates are like a reality check on your hiring game. When new people bail within 6-12 months, you're probably overselling the role or missing red flags during interviews. I've watched this happen so many times - it's painful. Good retention means you're actually finding people who fit and want to stay. Short, punchy truth: track which recruiters and job boards send you the people who stick around. Those are your goldmine sources. High turnover usually screams "we promised one thing, delivered another."
Honestly, recruitment cost is like your GPS for hiring - shows you exactly where to put your money. Track cost-per-hire by source first, then see which channels actually bring in good people who stick around. I made the mistake once of going super cheap on job posts... yeah, don't do that. Employee referrals might cost way less than those fancy job boards but deliver better candidates. The trick is looking at quality metrics too - how fast do new hires get productive? Do they stay? Short answer: calculate what you're spending now, then throw more budget at whatever's working best. Numbers don't lie.
Look, data analytics will show you exactly where your hiring process is breaking down. I track time-to-hire and candidate drop-off rates - that's where the magic happens. If people are bailing after phone screens, your process might be dragging on too long (learned this the hard way). Check which job boards actually deliver quality candidates vs just random applications. Conversion rates at each stage tell the real story. Don't overthink it though - start with maybe 3 key metrics and build from there. Once you see the patterns, you'll know what's worth fixing first.
Your recruitment metrics basically become your employer brand whether you like it or not. Candidates absolutely talk when your hiring process takes forever or when you ghost them after interviews. Offer acceptance rates, response times, candidate satisfaction scores - all of it feeds into what people say about working with you. Good metrics? People think you're professional and respect their time. Bad ones and you'll see it reflected in Glassdoor reviews pretty quickly. Honestly, if you're not already tracking candidate satisfaction, that's probably the best place to start since it shows you exactly how you're coming across.
So basically you want to track how many people make it through each step of your hiring process. Like if 100 people apply, how many get phone screens? Then interviews? It's just conversion rates between stages. The math isn't rocket science - if 20 out of 100 applicants get screened, that's 20%. Track these numbers monthly and you'll spot where people are bailing out. I'd pull maybe 3-6 months of data first to see your baseline, then keep an eye on it going forward. Honestly, most companies are shocked when they actually run these numbers for the first time. Shows you exactly where your process is broken.
So basically you'll see exactly where people are bailing in your hiring process. Like maybe tons of folks apply but then nobody makes it past the phone screen - that's a huge red flag right there. The funnel breaks down conversion rates at every step, from applications all the way to offer acceptance. Plus you can figure out which job boards actually send decent candidates (spoiler: it's probably not the expensive one). Honestly, the timing data is eye-opening too - you think interviews take a week but it's actually three. Instead of randomly fixing stuff, you'll know exactly what's actually broken.
Honestly, turnover data is like a diagnostic tool - it shows you exactly where your hiring's going wrong. High turnover in certain roles? Your job descriptions might be misleading or you're not screening properly. I've watched teams completely redo their interview questions after realizing everyone kept bailing at 6 months. The timing matters too. If people consistently leave around 90 days, that's totally an onboarding problem, not hiring. My old company had this issue and turns out new hires felt completely lost those first few months. Use the patterns to tweak your candidate profiles and interview focus.
-
Best way of representation of the topic.
-
The Designed Graphic are very professional and classic.
-
Unique design & color.
-
The Designed Graphic are very professional and classic.
-
I discovered this website through a google search, the services matched my needs perfectly and the pricing was very reasonable. I was thrilled with the product and the customer service. I will definitely use their slides again for my presentations and recommend them to other colleagues.