

Talent Acquisition Dashboard Powerpoint Ppt Template Bundles




Try Before you Buy Download Free Sample Product
 Impress Your
 Audience
 100%
100% Editable
 Save Hours
 of Time


Our Talent Acquisition Dashboard Powerpoint Ppt Template Bundles are topically designed to provide an attractive backdrop to any subject. Use them to look like a presentation pro.
People who downloaded this PowerPoint presentation also viewed the following :
Talent Acquisition Dashboard Powerpoint Ppt Template Bundles with all 17 slides:
Use our Talent Acquisition Dashboard Powerpoint Ppt Template Bundles to effectively help you save your valuable time. They are readymade to fit into any presentation structure.
-
Talent Acquisition Dashboard
-
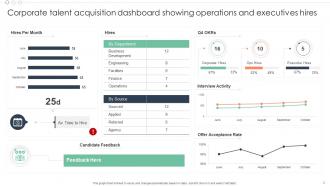
Corporate talent acquisition dashboard showing operations and executives hires
-
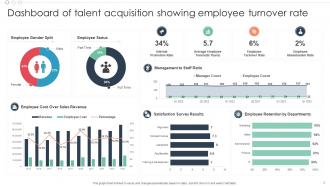
Dashboard of talent acquisition showing employee turnover rate
-
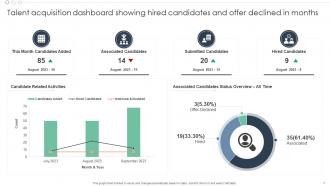
Talent acquisition dashboard showing hired candidates and offer declined in months
-
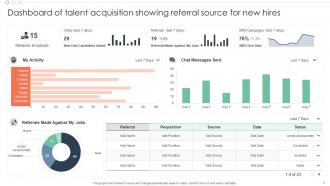
Dashboard of talent acquisition showing referral source for new hires
-
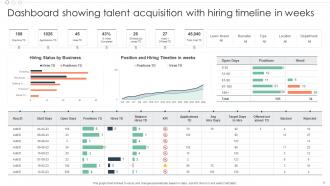
Dashboard showing talent acquisition with hiring timeline in weeks
-
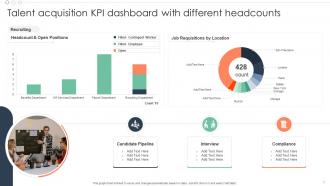
Talent acquisition KPI dashboard with different headcounts
-
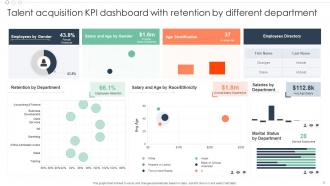
Talent acquisition KPI dashboard with retention by different department
-
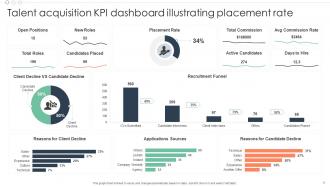
Talent acquisition KPI dashboard illustrating placement rate
-
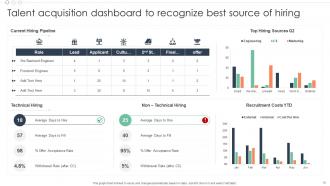
Talent acquisition dashboard to recognize best source of hiring
-
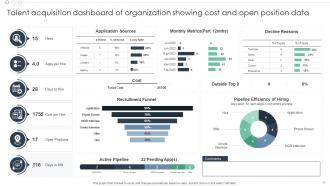
Talent acquisition dashboard of organization showing cost and open position data
-
Thanks for watching
-

-

-

-

-

FAQs for Talent Acquisition Dashboard Powerpoint
Focus on the basics first - time-to-fill, cost-per-hire, and which sources actually work. Then look at quality stuff like offer acceptance rates and how many people stick around after 90 days (seriously, this one saves you so much headache later). Track your pipeline health too - candidate volume at each stage, recruiter activity, that kind of thing. But don't get crazy with it. I've seen teams drown in like 15 different metrics they never actually use. Pick maybe 6-8 that match your biggest problems and check them weekly. You'll catch issues way faster that way.
So visual analytics basically saves you from drowning in those endless recruiting spreadsheets. You'll spot pipeline bottlenecks right away, see which job boards actually work, and track how long departments take to hire. It's pretty much like x-ray vision for recruiting - sounds cheesy but honestly true. The dashboards catch stuff you'd miss otherwise, like why certain postings flop or where candidates keep dropping out. My advice? Start with whatever's driving you most crazy right now, then build from there. Way less overwhelming that way.
So you know how recruiting feels like total chaos sometimes? Data viz actually helps with that mess. You can see exactly where candidates drop off in your pipeline and which job boards are worth your budget. Takes like five minutes to spot bottlenecks instead of digging through endless Excel rows. Your boss will definitely prefer pretty charts over raw data dumps when you're explaining why that senior dev role is still open after two months. Honestly, just start by mapping out your hiring funnel visually first - I bet you'll notice weird patterns right away.
So basically you gotta match the dashboard to what your industry actually cares about. Tech companies should track coding scores and GitHub stuff, healthcare needs certification tracking - that kind of thing. The default dashboards are honestly pretty useless for most people. Pipeline stages are huge too since hiring a cashier is nothing like finding a finance director, you know? I'd also look at where your best hires come from. Some industries live on referrals, others are all about job boards. Just pick your top 3-5 hiring headaches and build around tracking those specific things.
Honestly, I'd start with four solid metrics that actually matter. Time-to-productivity shows how fast new hires get up to speed. Then track your 90-day retention - that's honestly the most important one since it tells you if people actually want to stay. Hiring manager satisfaction scores are key too, plus performance ratings after their first year. Oh, and definitely track which job boards send you better candidates - some are just way better than others. Start simple with these four and add more detailed stuff later once you've got the basics down.
So attrition rates basically show you how fast you'll need to hire and where the biggest gaps will hit. High turnover in certain departments? The dashboard bumps up hiring forecasts for those spots automatically. Smart, right? It also highlights roles that always seem to hemorrhage people - which honestly is usually a red flag about pay, terrible managers, or insane workloads. Don't just keep hiring more bodies though. Check those attrition trends monthly so you can catch patterns early and tweak your recruitment game before you're frantically trying to fill critical spots.
Honestly, you'll be shocked at what source tracking reveals. I thought our LinkedIn Premium was crushing it, but turns out employee referrals were bringing way better hires. Look at your last 50 hires - where'd they come from? Then check their 90-day performance scores. That expensive job board might be total garbage while your free postings are gold. The whole point is seeing which channels actually deliver good people vs just flooding your inbox with junk. Once you know what works, dump the losers and put more money into your winners.
Dude, real-time data is a game changer for hiring. Instead of finding out weeks later that your process is broken, you'll catch problems instantly - like candidates bailing during phone screens or your recruiters getting swamped. I've seen companies miss out on great talent just because they didn't realize their pipeline was dying. You can pivot your sourcing strategy right away instead of playing catch-up. Honestly, being proactive beats scrambling every time. Set up alerts for your main metrics so you're not glued to dashboards all day.
So basically these dashboards break down your hiring pipeline by demographics - gender, race, age, all that stuff. Track where diverse candidates drop off at each stage. Honestly, the visual charts make it way easier to spot patterns than staring at boring spreadsheets all day. You'll see if your sourcing is actually bringing in diverse talent or just wasting time. Compare how different departments are doing, watch your progress over months. Oh, and set up alerts when your diversity numbers tank - catches problems before they get worse. Pretty useful for staying on top of things without manually crunching numbers constantly.
Honestly, Tableau and Power BI are your best bets for talent dashboards - both play nice with most ATS systems. Google Data Studio works too if budget's tight (and it's free, so your finance team won't hate you). Since you probably already have Greenhouse, Workday, or something similar, start there. The data's sitting right in your current systems anyway. Here's what I'd do: figure out what you're already using first, then pick whatever connects easiest. Trust me, you don't want to turn this into some massive integration nightmare. Keep it simple and actually get it done.
Honestly, just start simple - add quick surveys after each interview and get hiring managers to rate new hires a few months in. The timing's everything though, so set up automated triggers at each stage. Create little widgets on your dashboard showing feedback trends next to your normal stuff like time-to-hire. You'll catch patterns fast, like that one interviewer who makes everyone miserable or job boards sending you trash candidates. Oh, and keep surveys to 2-3 questions max - people won't fill out novels but they'll answer quick stuff. Way easier than you'd think once it's running.
So basically AI in your recruiting dashboard lets you predict stuff you'd miss otherwise - like which candidates will actually say yes to offers or where your hiring process gets stuck. Clean data is crucial though, or you'll get nonsense predictions. The bias thing is real too - algorithms can make existing problems worse if you're not watching. Honestly, I'd pick one thing to test first instead of going all-in. Make sure your team gets what the data means before they start making calls based on it. It's wild how much patterns it can catch that humans totally miss.
Honestly, dashboards are a game-changer for this stuff. No more texting "hey where are we with Sarah?" every other day. Everyone can see the same info - interview schedules, feedback, who's stuck where. Your hiring managers will actually know what's in their queue instead of pretending they forgot (we all know they didn't really forget). HR gets visibility into which managers are dragging their feet on reviews. You'll catch delays before they become disasters. Still gonna have endless Slack threads though, that's just life. Try doing weekly check-ins with the team using the dashboard data.
Honestly, less is more with dashboards. Stick to 5-7 metrics that actually matter instead of cramming everything on there - trust me, it gets messy quick. Think about who's using it too. Executives want different stuff than your recruiting team, you know? I've watched so many pretty dashboards completely bomb because they were slow or looked terrible on mobile. Make sure your data refreshes often enough to be useful. Oh, and always add context like targets or benchmarks - otherwise people stare at numbers wondering if they're good or trash. Start basic and just build from there based on what people tell you.
Honestly, dashboards are game-changers for employer branding. They show you what's actually working instead of just guessing. Track stuff like application quality and where your best hires come from - the results can be pretty eye-opening. Maybe your fancy LinkedIn campaigns aren't doing much, but that random job board is killing it. You'll also catch process bottlenecks that make candidates bail (and probably trash-talk you later). Pick 3-4 metrics that matter most to your brand goals. Don't go overboard with tracking everything - you'll just get overwhelmed with data you won't use anyway.
-
Loved the fact that SlideTeam provides clean, high-definition, and professional PowerPoint products.
-
Great experience, I would definitely use your services further.