


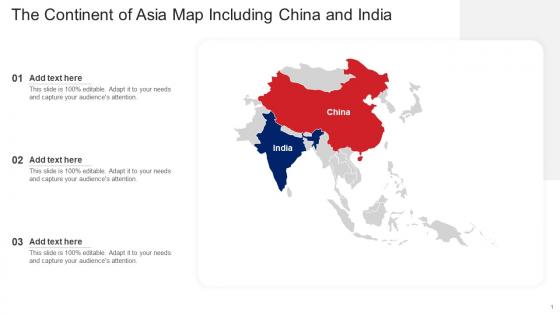
The Continent Of Asia Map Including China And India




Try Before you Buy Download Free Sample Product
 Impress Your
 Audience
 100%
100% Editable
 Save Hours
 of Time


Our The Continent Of Asia Map Including China And India are topically designed to provide an attractive backdrop to any subject. Use them to look like a presentation pro.
People who downloaded this PowerPoint presentation also viewed the following :
The Continent Of Asia Map Including China And India with all 9 slides:
Use our The Continent Of Asia Map Including China And India to effectively help you save your valuable time. They are readymade to fit into any presentation structure.








FAQs for The Continent Of Asia Map Including
Key geographical features on Asia maps include the Himalayas, Gobi Desert, Siberian Plains, Mekong and Ganges rivers, and major mountain ranges like the Urals and Hindu Kush. These features help organizations across logistics, agriculture, and energy sectors optimize supply chains, assess climate impacts, and identify strategic expansion opportunities, ultimately enhancing operational planning and competitive positioning.
Political boundaries in Asia significantly influence cultural identities by creating distinct national narratives, educational systems, and governmental policies that shape citizen perspectives. While these borders often unite diverse ethnic groups under single national identities, they also separate culturally similar populations across different countries, with nations like Korea, India, and China demonstrating how political divisions ultimately reshape traditional cultural expressions and practices.
Major rivers highlighted on Asia maps include the Yangtze, Yellow, Ganges, Indus, and Mekong, while mountain ranges feature the Himalayas, Urals, Hindu Kush, Tian Shan, and Altai Mountains. These geographical features enable businesses to understand regional logistics networks, natural resource distribution, and infrastructure planning opportunities, ultimately delivering strategic insights for market expansion and supply chain optimization across Asian markets.
An Asia map enables businesses to visualize key economic zones like ASEAN, identify major trade corridors such as the Belt and Road Initiative, and analyze market proximity for strategic expansion. Through geographic analysis, companies can optimize supply chain routes, assess regional partnerships, and understand trade flows between manufacturing hubs and consumer markets, ultimately delivering competitive advantages in increasingly interconnected Asian economies.
Major historical events shaping Asia's political map include colonial partitions by European powers, post-WWII decolonization movements, the 1947 India-Pakistan partition, and Cold War influences creating divided nations like North and South Korea. These transformative periods established current borders through independence movements, territorial negotiations, and geopolitical realignments, with many nations finding that colonial boundaries significantly influence modern diplomatic relationships and regional dynamics.
Asia's population density maps reveal concentrated urban corridors along coastlines, river deltas, and economic zones, with megacities like Tokyo, Mumbai, and Jakarta showing intense clustering. These visualizations demonstrate how urbanization concentrates in manufacturing hubs, financial centers, and trade routes, enabling businesses to identify emerging markets, optimize supply chains, and strategically position operations where demographic shifts create the greatest commercial opportunities.
Cartographic symbols serve as visual language elements that communicate geographic features, political boundaries, elevation changes, climate zones, and cultural landmarks across Asia's diverse terrain. These standardized symbols enable users to quickly interpret complex spatial information, from mountain ranges and river systems to population centers and trade routes, ultimately delivering enhanced geographic literacy and strategic understanding for educational, business, and planning applications.
Interactive maps enhance understanding of Asia's diverse landscapes by enabling real-time exploration of topographical features, climate zones, population densities, and cultural regions through layered data visualization. These digital tools allow users to zoom from macro views of the Himalayas to detailed coastal plains, while overlaying economic, demographic, and environmental data, ultimately delivering comprehensive geographical insights for educational institutions, businesses, and researchers analyzing this complex continent.
Territorial disputes illustrated on Asia maps present both diplomatic challenges and economic opportunities, affecting trade routes, resource access, and regional stability across multiple sectors. While these disputes can complicate international business operations, they also drive innovation in conflict resolution, strategic partnerships, and alternative supply chain development, with many multinational corporations finding adaptive strategies ultimately deliver competitive advantages.
Climate variability across Asia manifests through distinct geographical zones, from tropical rainforests in Southeast Asia to arctic tundra in Siberia, arid deserts in Central Asia, and monsoon-influenced regions across South Asia. These diverse climate patterns create complex geographical representations requiring detailed regional analysis, with many organizations finding that climate-specific mapping enhances resource planning and strategic decision-making.
Educational resources around Asia maps include interactive digital atlases, cultural comparison projects, economic development studies, historical timeline overlays, and geography-based learning modules. These tools enhance student understanding by connecting geographical knowledge with real-world applications in trade routes, population distribution, and regional development, while enabling educators to create engaging, cross-curricular lessons that strengthen spatial reasoning and global awareness skills.
Businesses leverage Asia maps for market analysis by visualizing demographic data, economic indicators, supply chain routes, competitor locations, and regional growth opportunities across diverse markets. Through geographic mapping tools, companies identify optimal expansion territories, assess market penetration strategies, and allocate resources more effectively, with many multinational corporations finding that visual market intelligence accelerates decision-making and reduces strategic risks.
Emerging market countries typically highlighted on Asia maps include India, Vietnam, Indonesia, Thailand, Philippines, Bangladesh, and Malaysia. These nations demonstrate rapid economic growth, expanding middle classes, and increasing foreign investment opportunities, with many multinational corporations finding that these markets offer significant potential for business expansion and revenue diversification in an increasingly competitive global landscape.
Asia's eco-regions demonstrate remarkable biodiversity variations, with tropical rainforests in Southeast Asia supporting the highest species density, temperate forests in East Asia offering moderate diversity, and arid regions like Central Asian steppes showing specialized but limited biodiversity. These regional differences enable organizations in conservation, research, and sustainable development to strategically allocate resources, prioritize protection efforts, and develop targeted environmental initiatives that deliver measurable conservation outcomes.
**INPUT**: What technological tools are available for creating custom maps of Asia? **OUTPUT**: Custom Asia mapping tools include GIS software like ArcGIS and QGIS, web-based platforms such as Google Maps API and Mapbox, and specialized cartographic applications like CartoDB and Adobe Illustrator. These technologies streamline map creation by offering real-time data integration, interactive visualization capabilities, and scalable deployment options, with many organizations finding enhanced presentations and strategic insights.
-
The way SlideTeam professionals work is exceptional. Thanks for being so helpful!
-
SlideTeam is my go-to resource for professional PPT templates. They have an exhaustive library, giving you the option to download the best slide!