

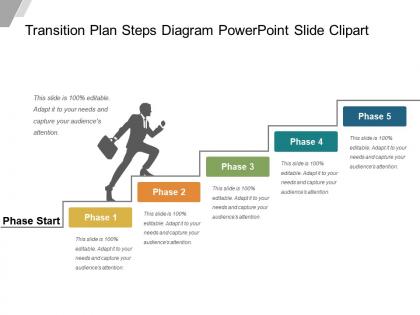
Transition plan steps diagram powerpoint slide clipart





Try Before you Buy Download Free Sample Product
 Impress Your
Audience
 100%
Editable
 Save Hours
of Time


Extend your existence to folks around. Establish a good connection with our Transition Plan Steps Diagram Powerpoint Slide Clipart.
People who downloaded this PowerPoint presentation also viewed the following :
Transition plan steps diagram powerpoint slide clipart with all 5 slides:
Our Transition Plan Steps Diagram Powerpoint Slide Clipart are excellent bonding agents. They forge enduring friendships.


FAQs for Transition plan steps diagram
So you'll want to map out your key responsibilities first, then work backwards from your last day. Build in buffer time because this stuff always drags longer than you think. Documentation is honestly the worst part but super critical - trust me, you don't want people hunting for your passwords later. Set clear handoff dates with who's taking what. Oh, and figure out how you'll update everyone along the way. Success metrics help too, though that feels a bit corporate. The timeline thing is huge - break it into chunks so you're not drowning at the end.
Honestly, diagrams are a lifesaver for transition planning. You can actually see how everything connects instead of juggling it all mentally from some dense text doc. Stakeholders love them too - way easier to explain when there's a visual roadmap showing timelines and who does what. Plus you'll catch bottlenecks that totally fly under the radar in bullet lists. I learned this the hard way after missing a huge dependency once (ugh). Short sentences work better than you'd think. Always sketch first, then worry about the fancy documentation later.
Honestly, scope creep is the worst - you'll start with one simple process and boom, you're mapping your entire company. Getting the right detail level is tricky too. Too much and people's eyes glaze over, too little and it's useless. Everyone on your team will have different opinions about what to include, which gets messy fast. Oh, and people always forget about dependencies between phases (learned that one the hard way). Just start small with one process you actually understand. Get people on board early or you'll be redoing everything later. Don't overthink the first version.
Honestly, visuals are a game changer for transition plans. Nobody wants to read through massive blocks of text - I know I zone out after like two sentences. Color code your different phases, throw in some icons for milestones, maybe a flowchart showing how everything connects. Stakeholders can actually see the timeline at a glance instead of hunting through paragraphs. Plus they'll catch problems or dependencies way faster when it's laid out visually. Even something simple like a timeline with markers will make your next review so much smoother.
So first thing - map out your key people: project manager, tech lead, business owner, end users. Anyone who's actually gonna make this work. Swim lanes are your friend here, or do a RACI chart if you're feeling fancy. Different colors for each role type helps too (honestly saves so much confusion later). The diagram needs to show how these people interact during each phase. I'd start with stakeholders first, then figure out who's doing what and when. Oh and don't overthink the visual stuff - sometimes simple is better than pretty.
Go with a horizontal timeline - way easier to follow than vertical ones. Mark your major milestones with circles or diamonds, whatever looks good to you. Color code different phases so people can actually tell what's happening when. Honestly, the biggest mistake is cramming too much stuff in there. Pick your 8-10 most important milestones and call it good. Space them evenly based on time periods. I'd start by plotting out your key dates first, then fill in the gaps with smaller milestones. Oh, and add short descriptions under each point so it's not just random shapes on a line.
Number everything clearly and stick to the same shapes - rectangles for tasks, diamonds for decisions, circles for milestones. Your text should be concise but actually useful (I've seen too many pretty diagrams that are basically useless). Colors work great for grouping phases or showing critical paths. Just don't go crazy with them. Flow should go left-to-right or top-to-bottom logically. Oh, and definitely test it on someone fresh - if they're confused, you'll need to simplify. Trust me on that one.
So basically you want to build feedback right into your diagram as actual visual elements. Add review checkpoints between major phases - think of them as "gates" where people can weigh in before you move to the next step. Include your feedback sources as real parts of the diagram too, like customer surveys or team input sessions. Honestly, most people treat feedback like an afterthought but it should be just as visible as your transition steps. Oh, and don't try to map everything at once - just start with your three most critical feedback points first. Makes the whole thing way less overwhelming.
Honestly, I'd go with Lucidchart or Miro for transition diagrams. Both are super visual and great for collaboration. Lucidchart has these really solid templates for project transitions that save you time upfront. Miro's more flexible if your team likes to brainstorm visually. Visio's okay if you're already locked into Microsoft everything, but it feels outdated compared to the others. Google Drawings works fine for simple stuff too – sometimes you don't need all the bells and whistles. The main thing is making sure everyone can actually access and edit it without jumping through hoops. Start with Lucidchart, see how it feels.
Oh totally, culture plays a huge role in this stuff. Some teams want everything documented to death, others just prefer talking through things. Hierarchy's another big one - I've seen transitions drag on forever because every little decision had to go up the chain first (super frustrating but what can you do). Meeting styles matter too. Language barriers might mean you need visual stuff or translators. Honestly, just ask your team upfront what works for them. Way easier than guessing wrong and having to backtrack later.
Okay so first thing - don't overthink the design. Clean labels, colors that actually make sense, and for the love of god don't put everything on one page. I always go left to right because people read that way naturally. Put it somewhere accessible like your team drive or whatever you guys use. Also make a simple version too because honestly? Most people won't read the detailed one anyway. Oh and test it on someone who doesn't know the project - if they're lost after 30 seconds, you need to simplify. Include a legend so people aren't guessing what stuff means.
Honestly, your transition diagram is pretty much worthless if people don't get what you're trying to do. I've watched perfectly good plans fail because nobody explained the "why" to anyone. You need to figure out who needs what info and when. Map your stakeholder groups right into the diagram itself. Show communication checkpoints at major milestones. Each group needs different messaging - what's changing, when it's happening, and why it matters to them specifically. Otherwise you'll just get pushback and confusion. Actually, start with the communication plan before you even finalize the transition steps.
Track the obvious stuff first - completion rates, retention, budget, timelines. But here's the thing: those numbers don't tell you if people actually think the transition sucked or not. Coffee chats and team check-ins matter way more than you'd expect. Send out some surveys to stakeholders too. Compare everything against your original goals - did you actually hit what you planned? Oh, and definitely do a formal review around 30-60 days after. Document what worked and what didn't for next time.
Honestly, I'd go with red borders or warning icons for the scary stuff - makes it super obvious where problems might hit. For dependencies, just use arrows or lines connecting tasks so people can follow the flow. Color coding works great too - red for the big disasters, yellow for stuff you can probably handle. Make sure everything flows left-to-right or top-to-bottom so anyone can trace what needs to happen when. Oh, and throw in a legend so people know what your symbols mean. Maybe add a little risk box on the side? The whole point is making trouble spots jump out immediately.
Honestly? Update that thing at every major milestone or when your scope gets blown up. First reassess where you are now versus where you're headed - stuff always shifts way more than planned, trust me. Adjust timelines and resources based on what you've actually learned. Get your key people involved in reviews too since they spot things you'll totally miss. Oh and document everything that changed and why, then tell your team right away. Set monthly calendar reminders or it'll just collect digital dust.
-
Great product with highly impressive and engaging designs.
-
Top Quality presentations that are easily editable.