


Trend analysis chart powerpoint templates




Try Before you Buy Download Free Sample Product
 Impress Your
 Audience
 100%
100% Editable
 Save Hours
 of Time


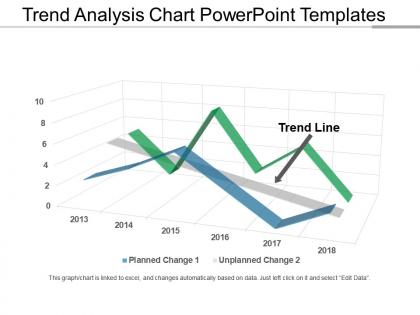
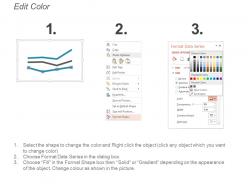
Allow traders to predict what will happen with the stock in the future using Trend Analysis Chart PowerPoint Templates. Based on historical data given, the overall trends of the market and particular indicators within the market, estimate the stock performance of your company. Take into account market conditions and competition for similar stocks that help traders forecast whether the stock has short, intermediate, and long term possibilities. Effortlessly predict the future stock price changes based on recently observed trend data using our statistical forecasting PPT template. Use this trend analysis PPT template to get a precise idea of the information you want to portray to your audience. Keep the structure and content of the document clear and understandable for the target audience. Make use of this readily available trend analysis PPT format to make an impressive presentation in less time.
People who downloaded this PowerPoint presentation also viewed the following :
Trend analysis chart powerpoint templates with all 5 slides:
Drum up the desired degree of enthusiasm with our Trend Analysis Chart Powerpoint Templates. You will be able to create the beat.
FAQs for Trend analysis
Start with the obvious stuff - sales numbers, website traffic, what people are searching for, social media buzz. Seasonal patterns will absolutely destroy your predictions if you ignore them (learned that one the hard way). Look at how your customers are changing too - demographics, buying habits, who your competitors are doing. Price changes matter big time. Don't just grab data from your best months though - you need like 12-18 months across everything to spot real trends versus random blips. Oh, and keep an eye on regulations or economic stuff that could mess with your market. Multiple data points beat single metrics every time.
Check your past sales data for patterns - stuff repeats more than you'd think. Seasonal bumps, slow periods, whatever. Go back 2-3 years if possible since one year could be weird (hello 2020). Break it down by products or regions to get specific. Once you spot the trends, project them forward but adjust for new stuff happening - competitors, market shifts, that kind of thing. Honestly, the biggest mistake is creating a forecast and never touching it again. Update it as fresh data rolls in. Also might want to segment by customer types since they probably buy differently.
Honestly, the speed difference is insane - tech can crunch through data that would take you months in like minutes. Machine learning gets better at spotting patterns the more you feed it, and real-time feeds mean you're not stuck with last week's numbers. The accuracy boost comes from eliminating those dumb human errors we all make when manually crunching spreadsheets. AI finds connections across millions of data points that you'd never catch otherwise. My advice? Figure out what data actually matters first (don't get distracted by every shiny metric), then find tools to automate the boring parts.
Totally! Google Trends is free and honestly pretty solid for starting out. Check your existing customer data first though - sales patterns, feedback, all that stuff you already have. Social media insights don't cost anything either. I'd set up Google Alerts for whatever keywords matter to your industry, then join some Facebook groups where your customers actually hang out. Statista has free reports too if you dig around. The trick is just being consistent about checking this stuff weekly instead of randomly. Sometimes you'll catch trends just by listening to what people are complaining about online.
Dude, biggest thing is you need way more data points - like 12-24 minimum or your trends are basically useless. People always mess up by cherry-picking dates that make their numbers look good, which is... obviously not helpful. Seasonality will totally screw you over if you ignore it. External stuff matters too - maybe your sales dropped because a competitor launched, not because your strategy sucked. Start simple though. Just throw your data on a basic line chart first and see what jumps out before you get all fancy with complex models. Trust me on this one.
Honestly, it comes down to speed and what data you're looking at. Finance moves crazy fast - prices and volumes shift by the second, so you need real-time everything. Healthcare's the opposite though, tracking patient outcomes over months or years with those long studies. Fashion sits weird in the middle and is honestly impossible to predict sometimes - you're watching social media trends, consumer mood, seasonal stuff. The tools are totally different too. Financial people live on those live dashboards, healthcare uses longitudinal studies, fashion teams obsess over social listening platforms. You've gotta match your approach to how fast that industry actually moves.
Honestly, just start with Excel or Google Sheets if your data isn't too crazy - they're way better than people think for spotting trends and making quick charts. Tableau and Power BI are solid upgrades when you need fancy interactive dashboards. Python with pandas is clutch if you can code (which... yeah, probably worth picking up at some point). Oh, and statisticians swear by R for time series stuff, though I've never gotten into it personally. But seriously, don't overthink the tool choice - use what you already know first, then figure out if you need something beefier based on how complex your data gets.
Just build it into your regular quarterly planning - treat trends like any other data you'd normally review. Focus on stuff that actually affects your business though, not whatever shiny thing LinkedIn is obsessing over this week. Look at how trends might hit your customers, competitors, and day-to-day ops over the next few years. Have your strategy team present these insights during planning meetings and use them to test your current projects or find new opportunities. Oh, and assign someone to keep tabs on key trends between cycles so you don't get blindsided.
Honestly, just nail down these three things: privacy, bias, and being upfront about your methods. Don't let personal data leak everywhere - follow those boring regulations. We're all guilty of cherry-picking data that backs up what we already think, so watch for that. Your analysis shouldn't accidentally screw over certain groups or reinforce stereotypes. Document your ethical stuff early on (saves headaches later). Be real about what your data can't tell you when you present. Keep asking yourself if this could hurt people in ways you didn't think of.
Honestly, charts and graphs are game-changers for trend analysis. People's brains just eat up visuals way faster than boring number tables. Line charts work great for showing patterns over time, heat maps handle complex data well. Color coding helps highlight the important stuff too. Interactive dashboards where people can hover or filter things? That's where you get real engagement from stakeholders. Keep your titles clear and colors consistent - oh, and ditch any unnecessary clutter on the charts. Trust me, a good visual beats staring at spreadsheet rows any day. Your audience will spot trends immediately instead of getting lost in the data.
Netflix saw their trend data showing DVD rentals tanking while internet speeds got better - boom, $15 billion streaming pivot. Amazon's gotten scary good at predicting what you want before you do, moving stuff to nearby warehouses ahead of time. Target? They figured out which customers were pregnant just from shopping patterns and started mailing baby coupons. Wild stuff. Point is, track how your customers behave even when it seems random - those weird connections usually lead to the biggest wins. Sometimes the most unrelated data points tell the best story.
Social media's basically a crystal ball for spotting trends before they hit mainstream. I'd track hashtags, sentiment around products, and what's blowing up on Twitter, Instagram, TikTok - you know the drill. Like that whole Stanley cup obsession that came out of nowhere (still don't get the hype tbh). Volume and tone tell you everything. Get some social listening tools to pull all this together and watch for patterns month to month. Pick 3-5 topics that actually matter for your business and just... keep tabs on them. Way cheaper than focus groups.
Honestly, focus on three main things: sentiment trends, volume changes, and recurring themes. Volume spikes usually mean something's either going really well or really wrong. Sentiment tells you if customers are getting happier or more pissed off over time. But here's the thing - I'd put most of my energy into tracking themes. That's where you'll spot specific issues before they explode everywhere. Watch how often the same complaints pop up each month. Oh, and set alerts for when negative stuff jumps 20% or more. You'll catch problems way earlier that way.
So seasonal stuff happens every year like clockwork - holiday rushes, summer slowdowns, whatever. Long-term trends are your big picture over several years. I learned this the hard way when I freaked out over a July slump that was totally normal lol. Use seasonal patterns for planning your inventory and staffing. Long-term trends show if you're actually growing beneath all that regular up-and-down noise. Without splitting them apart, you'll either panic over normal dips or miss real warning signs. Year-over-year comparisons are your friend here - cuts right through the seasonal chaos.
Dude, you absolutely need solid historical data or you're basically throwing darts blindfolded. I usually go back at least 2-3 years if possible - three data points technically make a trend, but that's way too risky for anything important. The more history you have, the better you'll spot actual patterns instead of just random fluctuations. Oh, and seasonal stuff becomes way more obvious with longer datasets. Just make sure your old data actually relates to what's happening now - like, don't use pre-pandemic numbers for retail forecasting lol. Always double-check your predictions against recent results too.
-
Appreciate the research and its presentable format.
-
Great quality slides in rapid time.