


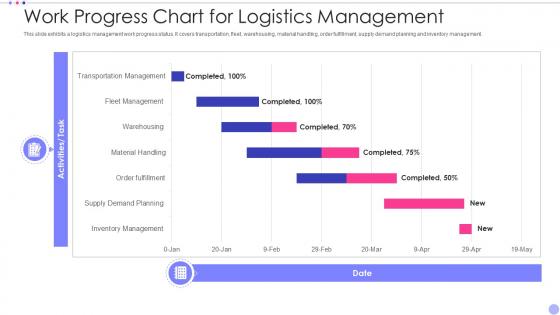
Work Progress Chart For Logistics Management




Try Before you Buy Download Free Sample Product
 Impress Your
 Audience
 100%
100% Editable
 Save Hours
 of Time


Our Work Progress Chart For Logistics Management are topically designed to provide an attractive backdrop to any subject. Use them to look like a presentation pro.
People who downloaded this PowerPoint presentation also viewed the following :
Work Progress Chart For Logistics Management with all 7 slides:
Use our Work Progress Chart For Logistics Management to effectively help you save your valuable time. They are readymade to fit into any presentation structure.





FAQs for Work Progress Chart
Key logistics metrics include delivery time, transportation costs, inventory turnover, order accuracy rates, and warehouse efficiency measures. These indicators streamline supply chain monitoring by tracking performance trends, identifying bottlenecks, and measuring customer satisfaction levels, with many organizations finding that comprehensive visibility ultimately delivers cost reductions and enhanced operational efficiency.
A logistics progress chart identifies bottlenecks by visually mapping delivery timelines, inventory levels, transportation delays, and processing stages across the entire supply chain. Through real-time tracking and milestone monitoring, companies can pinpoint where delays occur most frequently, enabling faster problem resolution, improved resource allocation, and ultimately enhanced operational efficiency that reduces costs and improves customer satisfaction.
Logistics progress chart software includes Microsoft Project, Smartsheet, Tableau, Power BI, and specialized logistics platforms like Oracle Transportation Management. These tools streamline supply chain visualization by automating data integration, enabling real-time tracking, and delivering customizable dashboards, with many logistics companies finding that comprehensive software solutions enhance operational efficiency and accelerate decision-making processes.
Visualization techniques enhance logistics data understanding by transforming complex datasets into intuitive charts, graphs, and dashboards that reveal patterns, bottlenecks, and performance trends. These visual tools enable logistics managers to quickly identify delivery delays, optimize route efficiency, and monitor inventory levels, with many supply chain organizations finding that visual analytics accelerates decision-making and improves operational responsiveness.
Real-time data integration enhances logistics progress chart accuracy by providing live shipment tracking, instant status updates, automated milestone recording, and immediate exception alerts. This continuous data flow enables logistics managers to identify delays instantly, adjust delivery schedules proactively, and maintain precise inventory levels, with many transportation companies finding that real-time visibility reduces customer complaints and streamlines operational decision-making.
Forecasting enables proactive logistics management by predicting demand patterns, identifying potential bottlenecks, and optimizing resource allocation before issues arise. Through predictive analytics and historical data analysis, logistics managers can anticipate capacity needs, adjust delivery schedules, and streamline inventory positioning, ultimately delivering improved customer satisfaction and operational efficiency.
Logistics progress charts aid inventory management decisions by providing real-time visibility into stock levels, delivery timelines, supplier performance, and demand patterns across multiple locations. Through visual data tracking, supply chain managers can identify bottlenecks, optimize reorder points, and reduce carrying costs, while maintaining adequate stock levels, ultimately enabling more responsive inventory strategies and minimizing both stockouts and excess inventory.
When presenting logistics progress charts to stakeholders, focus on clear data visualization, contextual storytelling, and actionable insights that align with business objectives. Use consistent formatting, highlight key performance indicators, and provide comparative analysis against benchmarks or previous periods. These practices enhance stakeholder understanding by simplifying complex logistics data, enabling faster decision-making, and ultimately delivering improved operational transparency and strategic alignment across supply chain management.
Logistics progress charts differ significantly across transportation modes, with air freight emphasizing speed milestones and real-time tracking, sea cargo focusing on port schedules and customs clearance phases, and land transport highlighting route optimization and delivery windows. These variations reflect each mode's unique operational requirements, with airlines prioritizing rapid transit updates, shipping companies tracking vessel movements and documentation, ultimately enabling logistics managers to optimize multi-modal strategies.
Common pitfalls include overcomplicating visual elements, using inconsistent metrics across timeframes, neglecting real-time data integration, poor color coding systems, and inadequate stakeholder input during design phases. These design flaws can mislead decision-making in supply chain operations, with many logistics managers finding that streamlined, standardized charts enhance operational transparency and ultimately deliver faster response times to disruptions.
KPIs can be effectively represented through visual elements like color-coded progress bars, trend lines, dashboard gauges, and comparative charts that track metrics such as delivery times, cost per shipment, and inventory turnover rates. These visualization methods enable logistics managers to quickly identify performance gaps, monitor operational efficiency, and make data-driven decisions, ultimately streamlining supply chain operations and enhancing customer satisfaction.
Customer feedback significantly impacts logistics progress tracking by identifying delivery bottlenecks, revealing service gaps, and highlighting areas requiring operational improvements. Through integrated feedback systems, logistics companies can adjust routes, enhance communication protocols, and optimize delivery schedules in real-time, with many finding that customer insights ultimately streamline operations and deliver superior service experiences.
Logistics progress charts for international supply chains should incorporate multi-currency tracking, customs clearance stages, regulatory compliance checkpoints, cross-border documentation status, and time zone considerations across different regions. These enhanced charts enable organizations to monitor complex international shipments by providing real-time visibility into delays, regulatory bottlenecks, and multi-modal transportation handoffs, ultimately delivering improved customer communication and reduced supply chain risks.
Successful logistics progress tracking implementations include Walmart's RFID inventory systems, Amazon's real-time package monitoring, FedEx's shipment visibility platforms, UPS's route optimization technology, and DHL's predictive analytics dashboards. These systems streamline supply chain visibility, reduce delivery times, and minimize operational costs, with many retailers and e-commerce companies finding that enhanced tracking delivers improved customer satisfaction and competitive advantage.
Automation enhances logistics progress chart creation by streamlining data collection, enabling real-time tracking updates, and automatically generating visual reports from multiple systems. Through integrated platforms, logistics companies can monitor shipment statuses, inventory levels, and delivery timelines seamlessly, while reducing manual errors and accelerating decision-making processes for improved operational efficiency.
-
A beautiful, professional design paired with high-quality images and content that is sure to impress. It is a must-use PPT template in my opinion.
-
Topic best represented with attractive design.