


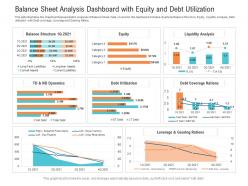
Balance sheet analysis dashboard with equity and debt utilization powerpoint template





Try Before you Buy Download Free Sample Product
 Impress Your
Audience
 100%
Editable
 Save Hours
of Time


Our Balance Sheet Analysis Dashboard With Equity And Debt Utilization Powerpoint Template are topically designed to provide an attractive backdrop to any subject. Use them to look like a presentation pro.
People who downloaded this PowerPoint presentation also viewed the following :
Balance sheet analysis dashboard with equity and debt utilization powerpoint template with all 2 slides:
Use our Balance Sheet Analysis Dashboard With Equity And Debt Utilization Powerpoint Template to effectively help you save your valuable time. They are readymade to fit into any presentation structure.

FAQs for Balance sheet analysis dashboard with equity and debt
So a balance sheet has three chunks - assets (stuff you own), liabilities (money you owe), and equity (what's actually yours). Current assets are like cash and inventory you can turn into money quickly, while non-current is buildings and equipment. Same deal with liabilities - some due this year, others long-term. Here's the thing that always trips people up: Assets = Liabilities + Equity has to work perfectly or your numbers are screwed. When you're checking if a company's healthy, look at current ratios and whether they're drowning in debt compared to equity.
Honestly, trend analysis is a game-changer for understanding financial health. Compare balance sheet stuff over 3-5 years instead of just one snapshot. Track debt-to-equity ratios, working capital, asset growth - you know, the big picture metrics. One year's data can be super misleading! Like, if debt keeps climbing or cash reserves are shrinking, those are major red flags you'd totally miss otherwise. I usually pick 4-5 key ratios and chart them quarterly. Makes it way easier to catch problems before they blow up. Way better than trying to guess from random numbers.
So there are three ratios I'd look at. Current ratio is your basic one - current assets divided by current liabilities. Above 1.0 and you're good. Quick ratio does the same thing but cuts out inventory since that stuff's harder to turn into cash fast. I honestly use this one the most because it feels more real-world. Then there's the cash ratio, which is super conservative - just your actual cash versus what you owe. Calculate all three and watch for weird trends. Oh, and don't stress if they're not perfect - most businesses aren't sitting on tons of cash anyway.
So debt-to-equity ratio shows how much debt a company has compared to equity. Higher numbers = more debt = riskier, especially if the economy tanks and they can't cover interest payments. Lower ratios are safer but sometimes means they're playing it too safe and missing growth chances. You gotta compare companies in the same industry though - like, tech companies naturally have different borrowing patterns than utilities or whatever. Honestly, I never look at D/E alone. Pair it with other financial stuff to see if their borrowing strategy fits what you're comfortable with risk-wise.
So retained earnings is just all the profits your company made but didn't hand out as dividends - it stays in the business instead. Picture it like the company's savings account that grows over time. It's a huge chunk of stockholders' equity, showing how much wealth you've actually created versus what investors originally threw in. Growing retained earnings? Usually means you're doing something right with profitability. Here's what I always check though - compare it to your total equity so you can tell if growth comes from actual earnings or just fresh investor cash coming in.
Dude, big gaps between balance sheet and cash flows? Major red flag. Net income looks amazing but operating cash flow sucks? They're probably messing with revenue recognition or can't collect what people owe them. I've seen companies report "profits" while literally burning cash - makes zero sense, right? Also check if working capital changes actually match between statements. Sometimes they don't and that's sketchy. My rule: always compare both statements. When the story doesn't add up, dig way deeper before trusting anything.
Honestly, financial comparison is where you really see what's going on. Debt levels tell you everything - some companies are loaded up while others play it safe. Revenue per dollar of assets shows who's actually efficient with their money. Working capital ratios are my favorite thing to dig into because they expose operational problems fast. Different growth strategies become obvious too. Some companies fund expansion through debt, others just use profits they've saved up. Benchmark against the top performers and you'll spot exactly where you're falling behind. It's like getting a roadmap of what actually works in your industry.
Dude, off-balance-sheet stuff is sneaky as hell. Companies hide debt in operating leases, weird shell entities, or contingent deals that don't show up on the main balance sheet. You'll look at their debt ratios thinking they're solid, but they could be drowning in hidden obligations. The footnotes are where you need to dig - I know, boring as watching paint dry, but that's where they bury the real mess. Check for any mentions of off-balance-sheet items because those pretty ratios might be total BS without the full picture.
A liability spike isn't automatically terrible - you just gotta figure out what caused it. Maybe they took on debt for expansion (could be smart) or made a big acquisition. Sometimes it's just cash flow issues piling up. Timing matters though. End-of-quarter jumps might be totally normal business stuff. Look at how it compares to their assets and revenue growth. If liabilities are shooting up way faster, that's sketchy. Check their debt-to-equity ratio too - can they actually pay this back? The footnotes usually explain what happened, so don't freak out until you read those first.
So basically they need to speed up cash collection and cut inventory that's just sitting around. Pay off expensive debt first - that interest is killing them. Sell off stuff that doesn't really fit their main business anymore. You know what's smart? Refinancing high-rate loans with cheaper ones, or switching short-term debt to long-term so they're not scrambling for cash every quarter. It's honestly like cleaning out your garage - keep what you actually use, ditch the rest. Focus on the biggest money drains first, then work down from there.
Looking at balance sheets over time is honestly one of the best ways to see where a company's really headed. Pull like 3-4 quarters of data and watch for patterns - is debt climbing faster than sales? Inventory piling up? Those are red flags. Asset turnover ratios tell you tons about whether management's getting their act together or falling apart. Working capital trends are huge too. Don't just look at one quarter though, that's basically useless. The real story shows up when you compare how things change quarter to quarter.
So balance sheets are kinda tricky - they're just one moment frozen in time, right? You're missing all the cash flow patterns and seasonal stuff that actually matters. Brand value, customer loyalty, market position? None of that shows up even though it's often what really drives success. Companies can also play games with the timing of transactions to make things look better than they are. I always think you need the whole picture - income statement, cash flows, plus just understanding the business itself. Otherwise you're basically flying blind with half the story.
Dude, intangibles are tricky as hell on balance sheets. Goodwill from old acquisitions? Often complete garbage now. Patents and strong IP can be solid gold though. The annoying part is companies don't even record internally developed stuff, so you're missing huge chunks of real value. Book value gets all inflated but doesn't tell you what things are actually worth. I always check the footnotes first - seriously, that's where they hide whether these numbers mean anything or if it's just accounting BS. Don't trust the headline figures.
Startups are tricky - you gotta look at cash burn and runway first. How long can they actually survive? Their balance sheets are basically wishful thinking half the time, so don't trust those asset values. I've seen too many "innovative IP assets" that were worth nothing. Established companies? Way different story. You can actually believe their numbers more. Check debt ratios, working capital trends, how efficiently they're using assets. Mature firms should show steady equity growth while startups will just have losses piling up. Honestly, treat startup financials like your friend's dating stories - sounds great but verify everything.
Ugh, changing accounting standards totally mess up balance sheet comparisons. Your 2020 numbers won't match 2024 because new rules change how you classify assets or measure things. Take those new lease standards - they shoved operating leases right onto balance sheets, which honestly caught a lot of people off guard. Different measurement methods pop up too. You'll want to dig into the footnotes for any restatements they did. Pro forma adjustments help make trend analysis actually work, but it's still a pain to deal with.
-
Great experience, I would definitely use your services further.
-
Informative presentations that are easily editable.
-
Unique and attractive product design.
-
Unique and attractive product design.
-
Topic best represented with attractive design.
-
Excellent Designs.
-
Good research work and creative work done on every template.
-
Easily Editable.
-
Content of slide is easy to understand and edit.
-
Appreciate the research and its presentable format.