Bar graph showing customer spending distribution using age demographic
Our Bar Graph Showing Customer Spending Distribution Using Age Demographic are topically designed to provide an attractive backdrop to any subject. Use them to look like a presentation pro.
Our Bar Graph Showing Customer Spending Distribution Using Age Demographic are topically designed to provide an attractive ..
- Google Slides is a new FREE Presentation software from Google.
- All our content is 100% compatible with Google Slides.
- Just download our designs, and upload them to Google Slides and they will work automatically.
- Amaze your audience with SlideTeam and Google Slides.
-
Want Changes to This PPT Slide? Check out our Presentation Design Services
- WideScreen Aspect ratio is becoming a very popular format. When you download this product, the downloaded ZIP will contain this product in both standard and widescreen format.
-

- Some older products that we have may only be in standard format, but they can easily be converted to widescreen.
- To do this, please open the SlideTeam product in Powerpoint, and go to
- Design ( On the top bar) -> Page Setup -> and select "On-screen Show (16:9)” in the drop down for "Slides Sized for".
- The slide or theme will change to widescreen, and all graphics will adjust automatically. You can similarly convert our content to any other desired screen aspect ratio.
Compatible With Google Slides

Get This In WideScreen
You must be logged in to download this presentation.
PowerPoint presentation slides
Presenting this set of slides with name Bar Graph Showing Customer Spending Distribution Using Age Demographic. The topics discussed in these slide is Bar Graph Showing Customer Spending Distribution Using Age Demographic. This is a completely editable PowerPoint presentation and is available for immediate download. Download now and impress your audience.
People who downloaded this PowerPoint presentation also viewed the following :
Content of this Powerpoint Presentation
Description:
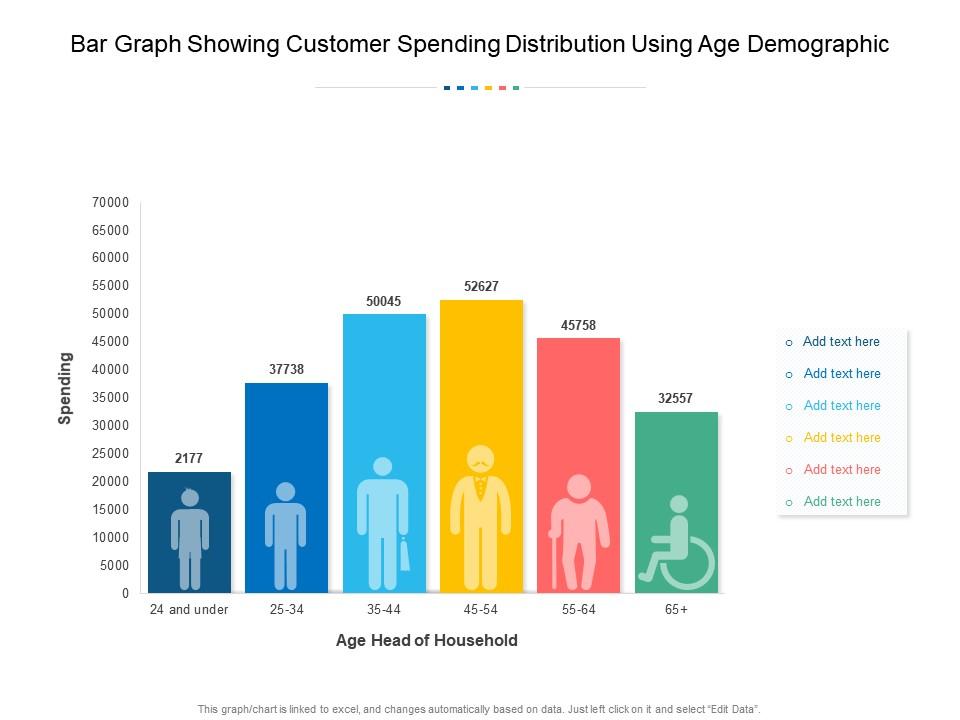
The image displays a bar graph titled "Bar Graph Showing Customer Spending Distribution Using Age Demographic." It visualizes spending amounts for different age groups represented by icons. The age groups are '24 and under', '25-34', '35-44', '45-54', '55-64', and '65+'. The corresponding spending values are 2177, 37738, 50045, 52627, 45758, and 32557, respectively. These figures are most likely in currency units, but the specific currency is not indicated. There are placeholders to add text, indicating that the slide is a template meant to be customized.
Use Cases:
Industries where this slide could be particularly useful include:
1. Retail:
Use: Customer segmentation analysis.
Presenter: Marketing Analyst.
Audience: Marketing team, product managers.
2. Financial Services:
Use: Investment strategy based on demographic spending.
Presenter: Financial Planner.
Audience: Clients, investors.
3. Healthcare:
Use: Allocation of healthcare resources.
Presenter: Health Economist.
Audience: Policy makers, hospital administrators.
4. Real Estate:
Use: Targeting housing markets.
Presenter: Real Estate Developer.
Audience: Investors, sales agents.
5. Consumer Electronics:
Use: Product development and marketing.
Presenter: Product Manager.
Audience: R&D team, marketing department.
6. E-commerce:
Use: Tailoring online shopping experience.
Presenter: E-commerce Strategist.
Audience: Web designers, UX/UI team.
7. Automotive:
Use: Vehicle sales trends by demographic.
Presenter: Sales Manager.
Audience: Dealership owners, sales teams.
Bar graph showing customer spending distribution using age demographic with all 2 slides:
Use our Bar Graph Showing Customer Spending Distribution Using Age Demographic to effectively help you save your valuable time. They are readymade to fit into any presentation structure.
-
Good research work and creative work done on every template.
-
Qualitative and comprehensive slides.
-
Informative presentations that are easily editable.
-
Colors used are bright and distinctive.


