


Diapositivas de presentación de Powerpoint de características y procesos de Big Data





Try Before you Buy Download Free Sample Product
 Impress Your
 Audience
 100%
100% Editable
 Save Hours
 of Time


Le presentamos características de Big Data listas para el contenido y procesamos presentaciones de PowerPoint que se pueden utilizar para presentar técnicas de gestión de contenido. Puede ser presentado por firmas de consultoría y análisis de TI a sus clientes o la gerencia de la empresa. Este diseño PPT de administración de bases de datos relacionales consta de 53 diapositivas que incluyen introducción, hechos, qué tan grande es el big data, pronóstico del mercado, fuentes, 3V y 5V pequeños Vs big data, objetivo, tecnologías, flujo de trabajo, cuatro fases, tipos, proceso de análisis de información, impacto , beneficios, futuro, oportunidades y desafíos, etc. Nuestras plantillas de PowerPoint de transformación de datos son aptas para presentar diversos temas como conceptos y tecnologías de gestión de información, transformación de hechos con inteligencia, marco de análisis de datos, minería de datos, plataformas tecnológicas, transferencia y visualización de datos, contenido gestión, Internet de las cosas, almacenamiento y análisis de datos, infraestructura de información, conjuntos de datos, tecnología y computación en la nube. Descargue características de big data y procese gráficos PPT para hacer una presentación impresionante. Desarrolle una mayor buena voluntad con nuestras diapositivas de presentación de Powerpoint de características y procesos de Big Data. La gente se siente más amigable con usted.
People who downloaded this PowerPoint presentation also viewed the following :
Contenido de esta presentación de Powerpoint
Diapositiva 1 : Esta diapositiva presenta las características y el proceso de Big Data. Indique el nombre de su empresa y comience.
Diapositiva 2 : Esta es una diapositiva de Agenda. Muestre sus agendas aquí.
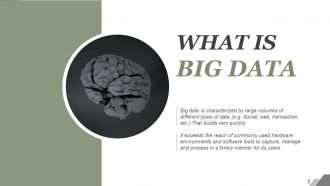
Diapositiva 3 : Esta diapositiva presenta Qué es Big Data y su definición.
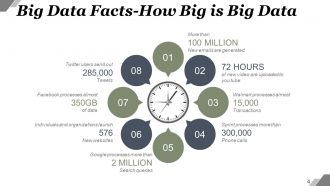
Diapositiva 4 : Esta diapositiva muestra los hechos de Big Data: qué tan grande es Big Data, etc.
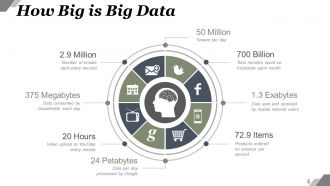
Diapositiva 5 : Esta diapositiva muestra el tamaño de los macrodatos en términos de datos, números, etc.
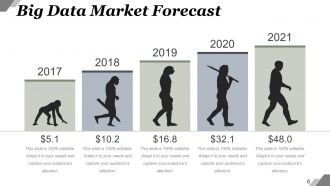
Diapositiva 6 : esta diapositiva muestra el pronóstico del mercado de Big Data en forma de gráfico creativo.
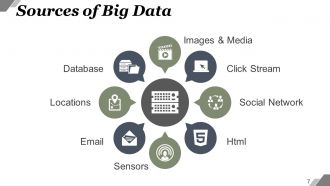
Diapositiva 7 : esta diapositiva muestra las fuentes de macrodatos. Las fuentes son: imágenes y medios, base de datos, ubicaciones, correo electrónico, flujo de clics, red social, html. Sensores
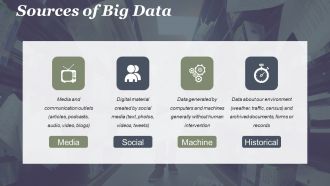
Diapositiva 8 : Esta diapositiva muestra las fuentes de Big Data categorizadas como: Medios (medios y medios de comunicación (artículos, podcasts, audio, video, correo electrónico, blogs)) Máquina (datos generados por computadoras y máquinas generalmente sin intervención humana (registros de procesos comerciales, sensores, llamadas telefónicas)} Social {Material digital creado por las redes sociales (texto, fotos, videos, tweets)} Histórico (Datos sobre nuestro entorno (clima, tráfico, censo) y documentos, formularios o registros archivados)
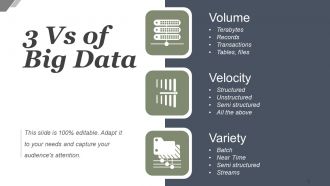
Diapositiva 9 : Esta diapositiva muestra 3 V de Big Data. Son: variedad, velocidad, volumen.
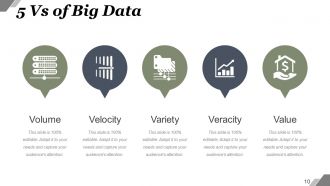
Diapositiva 10 : Esta diapositiva presenta 5 Vs de variedad, volumen, velocidad, valor y veracidad de Big Data.
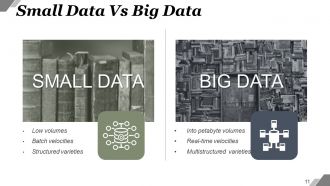
Diapositiva 11 : Esta diapositiva muestra una comparación de datos pequeños (volúmenes bajos, velocidades de lote, variedades estructuradas) versus datos grandes (en volúmenes de petabytes, velocidades en tiempo real, variedades multiestructuradas).
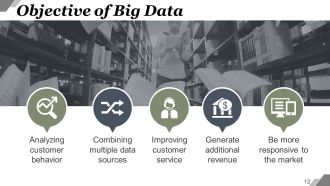
Diapositiva 12 : Esta diapositiva presenta el objetivo de Big Data: analizar el comportamiento del cliente, combinar múltiples fuentes de datos, mejorar el servicio al cliente, generar ingresos adicionales.
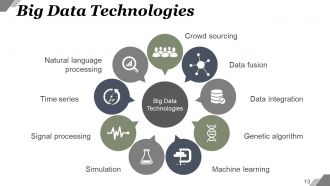
Diapositiva 13 : Esta diapositiva muestra las tecnologías de Big Data. Los enumerados son: Integración de datos, Algoritmo genético, Aprendizaje automático, Lenguaje natural, Procesamiento, Procesamiento de señales, Series de tiempo, Simulación, Crowd Sourcing, Fusión de datos.
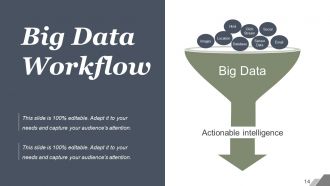
Diapositiva 14 : Esta diapositiva presenta el flujo de trabajo de Big Data en forma de embudo que muestra: inteligencia procesable, correo electrónico, flujo de clics, Html, redes sociales, ubicación, base de datos, datos de sensores, imágenes.
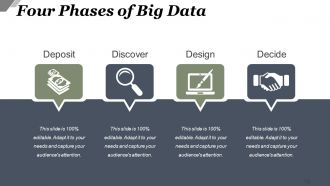
Diapositiva 15 : Esta diapositiva muestra las cuatro fases del Big Data: depositar, descubrir, decidir y diseñar.
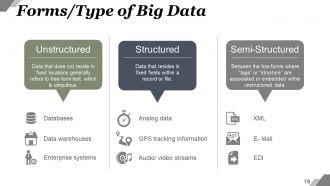
Diapositiva 16 : Esta diapositiva muestra Formas / Tipo de Big Data: semiestructurado, no estructurado, estructurado.
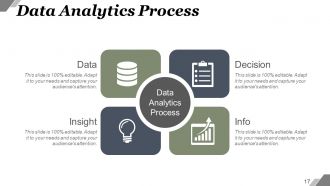
Diapositiva 17 : Esta diapositiva presenta el proceso de análisis de datos dividido en: datos, información, decisión, conocimiento.
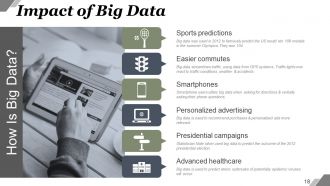
Diapositiva 18 : esta diapositiva muestra el impacto de los macrodatos. Los ejemplos son: predicciones deportivas, viajes más fáciles, teléfonos inteligentes, atención médica avanzada, campañas presidenciales, publicidad personalizada.
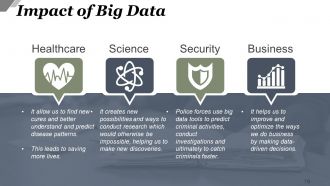
Diapositiva 19 : Esta diapositiva muestra el impacto de los macrodatos utilizados en la atención médica, la ciencia, la seguridad y los negocios.
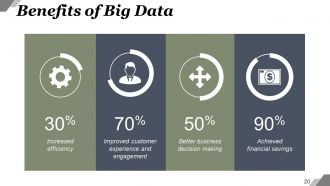
Diapositiva 20 : Esta diapositiva muestra los Beneficios de Big Data como: Mayor eficiencia, Mejor toma de decisiones comerciales, Mejor experiencia y compromiso del cliente, Ahorro financiero logrado.
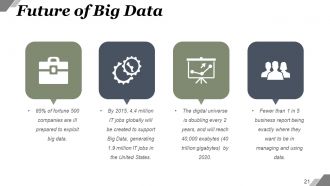
Diapositiva 21 : esta diapositiva presenta el futuro de los macrodatos. Puede agregar sus propios ejemplos aquí.
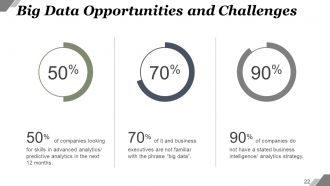
Diapositiva 22 : Esta diapositiva muestra los desafíos y oportunidades de Big Data. Indíquelos aquí.
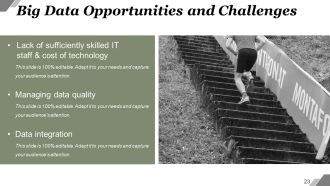
Diapositiva 23 : Esta diapositiva muestra los desafíos y oportunidades de Big Data. Algunos ejemplos son: falta de personal de TI suficientemente capacitado y costo de la tecnología, gestión de la calidad de los datos, integración.
Diapositiva 24 : Esta es la diapositiva del Conjunto de iconos de características de Big Data. Puede utilizar los iconos según sus necesidades.
Diapositiva 25 : esta diapositiva se titula Diapositivas adicionales para avanzar. Puede cambiar el contenido de la diapositiva según sus necesidades.
Diapositiva 26 : Esta es la diapositiva de Nuestra misión. Dígalo aquí.
Diapositiva 27 : Esta es la diapositiva Conozca a nuestro equipo con nombres, designaciones y cuadros de imagen para completar la información.
Diapositiva 28 : Esta es una diapositiva Acerca de nosotros. Indique aquí las especificaciones de la empresa / equipo.
Diapositiva 29 : Diapositiva Esta es nuestra meta. Indíquelos aquí.
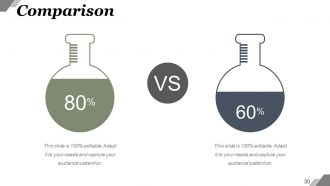
Diapositiva 30 : Esta diapositiva muestra la comparación en imágenes flash. Indique aquí los aspectos de comparación, etc.
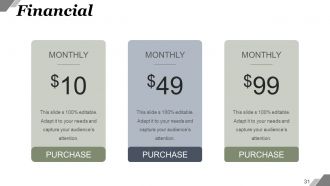
Diapositiva 31 : Esta es una diapositiva de puntuación financiera. Indique aquí los aspectos financieros.
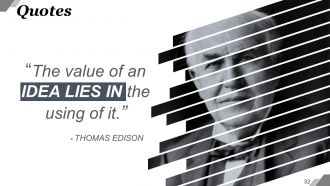
Diapositiva 32 : Esta diapositiva muestra Cotizaciones. Muestre aquí su mensaje, creencias, etc.
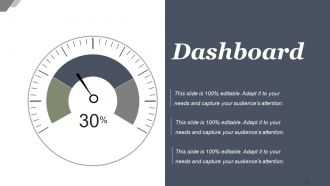
Diapositiva 33 : esta diapositiva muestra el panel con imágenes y cuadros de texto.
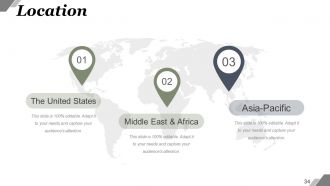
Diapositiva 34 : esta diapositiva muestra la ubicación en la imagen del mapa mundial. Muestre presencia global, crecimiento, etc. aquí.
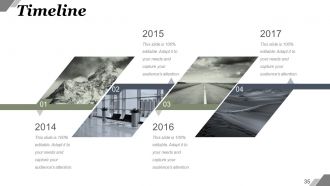
Diapositiva 35 : Esta es una diapositiva de la línea de tiempo. Muestre hitos, logros, crecimiento, viaje, etc. aquí.
Diapositiva 36 : Esta es una diapositiva Post It para marcar recordatorios, eventos, etc.
Diapositiva 37 : Esta es una diapositiva de imagen de un periódico para mostrar eventos, aspectos destacados, etc.
Diapositiva 38 : esta es una diapositiva de imagen de rompecabezas para mostrar información, especificaciones, etc.
Diapositiva 39 : Esta diapositiva muestra Target. Indíquelos aquí.
Diapositiva 40 : Esta es una diapositiva de imagen circular. Indique la información, la especificación, etc. aquí.
Diapositiva 41 : Esta es una diapositiva del diagrama de Venn. Indique la información, la especificación, etc. aquí.
Diapositiva 42 : Esta es una diapositiva de mapa mental. Indique la información, la especificación, etc. aquí.
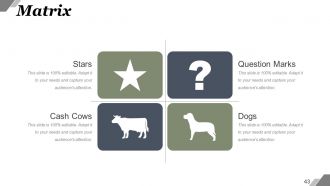
Diapositiva 43 : Esta es una diapositiva de matriz. Indique la información, la especificación, etc. aquí.
Diapositiva 44 : Esta es una diapositiva de Lego Box. Indique la información, la especificación, etc. aquí.
Diapositiva 45 : esta diapositiva muestra siluetas con cuadros de texto. Indique aquí la información relacionada con las personas, las especificaciones, etc.
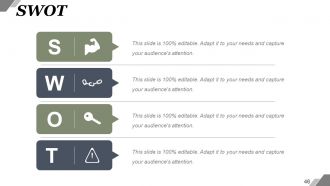
Diapositiva 46 : Esta es una diapositiva de análisis FODA.
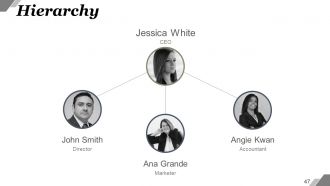
Diapositiva 47 : Esta es una diapositiva de jerarquía. Indique aquí la información, la estructura de la organización, etc.
Diapositiva 48 : Esta es la diapositiva Generar idea. Indique aquí información, especificaciones, aspectos innovadores, etc.
Diapositiva 49 : Esta es una diapositiva con imagen de lupa. Indique aquí la información, la especificación, los aspectos de alcance, etc.
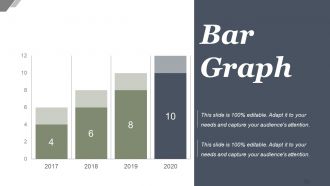
Diapositiva 50 : Esta es una diapositiva de gráfico de barras para mostrar información de producto / entidad, especificaciones, comparación, etc. aquí.
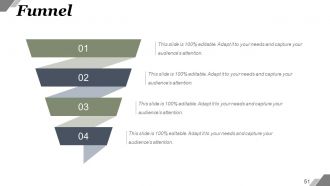
Diapositiva 51 : Esta es una diapositiva de imagen de embudo. Indique la información, la especificación, el aspecto / matices de canalización aquí.
Diapositiva 52 : Esta es una diapositiva Contáctenos con Dirección # número de calle, ciudad, estado, números de contacto, dirección de correo electrónico.
Diapositiva 53 : Esta es una diapositiva de agradecimiento como agradecimiento.
Diapositivas de presentación de Powerpoint de características y procesos de Big Data con las 53 diapositivas:
Haga que broten con nuestras diapositivas de presentación de Powerpoint de características y procesos de Big Data. Pronto lo adularán.








FAQs for Big Data Characteristics And Process
Honestly, storage costs will bite you first - that stuff scales way faster than anyone warns you about. Data quality is another headache since everything's messy and from different sources that hate each other. Finding decent data people is brutal right now too, everyone's fighting over the same talent pool. Oh, and they're not cheap either. I'd definitely test things out with something small first. Figure out what's actually gonna break before you go all-in on some expensive platform or start hiring a whole team. Trust me on this one.
Honestly, big data is just taking all the random info your company has lying around and turning it into stuff you can actually use. You know how you usually make decisions based on hunches or those quarterly reports that are already outdated? This lets you see what customers are really doing, catch trends before they blow up, and figure out where you're bleeding money. It's pretty wild – like having a decent crystal ball that actually works. My advice? Don't overthink it. Pick one problem that's bugging you, throw some data at it, and see what patterns pop up. Way better than guessing.
So you know how big data is just... overwhelming? ML is what actually makes it useful. It spots patterns humans would never catch manually - like, we're talking massive datasets here. You can classify stuff automatically, predict what's coming next, catch weird anomalies. Honestly, without it you're just staring at spreadsheets forever (been there, not fun). Traditional analytics completely falls apart at this scale. If you're just starting out, try basic clustering first - you'll see results fast and it won't melt your brain right away.
First thing - do a data inventory so you actually know what sensitive stuff you're collecting. Build encryption and access controls into your architecture from the start, don't tack them on later. Set up governance policies for who gets access to what data. The regulatory stuff (GDPR, CCPA, etc.) changes constantly and honestly it's a pain, but you can't ignore it. Regular audits will save your butt before small issues turn into massive headaches. Data anonymization is clutch too - probably should've mentioned that earlier.
Heat maps and interactive dashboards are your best bet - they let people click around and actually explore the data. Scatter plots are solid for showing correlations, and treemaps work well when you've got hierarchical stuff to display. But honestly? I see so many messy charts that just overwhelm people. Start with the big picture, then let users dig deeper if they want to. Oh, and Tableau or Power BI can handle most of this without making you code everything from scratch. The whole point is telling a story, not cramming every data point onto one screen.
Honestly, you don't need a huge budget for this stuff. Google Analytics is free and shows you tons about how people use your site. Same with Facebook Insights - I'm always surprised how detailed it gets about who's actually seeing your posts. Start collecting emails and track what people buy using something basic like HubSpot's free version. The trick is working with what you've got first, then adding fancier tools later when you're making more money. Maybe just pick one thing to track this week and see what happens?
So machine learning is everywhere in big data now - pattern recognition, predictive stuff, you name it. Edge computing's really taking off too because it handles data right where it starts instead of sending everything to some distant server. Most companies are ditching their on-premise setups for cloud tools (honestly can't blame them). Real-time streaming analytics is pretty standard now. Even quantum computing's starting to creep in for the really complex calculations, though that's still pretty niche. You should definitely pick up one of the major cloud platforms - AWS, Azure, whatever. Makes scaling so much less of a nightmare when you're dealing with huge datasets.
So basically, big data helps you figure out what customers actually want by looking at their behavior and purchase history. You can predict their needs before they do - which honestly feels a bit creepy but works really well. It's great for targeted marketing and those product recommendations that make people think "how did they know?" You'll also spot where customers get frustrated in their journey. Oh, and it helps predict when you're gonna get slammed with support tickets. The trick is moving fast on these insights so customers feel like you actually understand them.
Honestly, it's wild how companies are basically mind-reading their customers now. Retailers track your buying habits to guess what you'll want next. Banks scan transactions to spot fraud before you even notice. Healthcare is probably the coolest though - they dig through patient data to find disease patterns and create better treatments. Manufacturing plants use sensors to fix machines before they break down (saves them tons). Oh, and airlines? They're constantly tweaking prices based on demand. Most businesses already have the data sitting there - they just don't realize how much they could do with it.
Honestly, start with figuring out how much data you're dealing with and how fast it's coming in - that'll narrow down your options real quick. Budget matters too because these systems can get expensive if you're not careful. Does your team actually know how to work with whatever you pick? There's no shame in choosing something simpler that people can actually manage. Real-time vs batch processing is a big decision point. Oh, and definitely think about security stuff if you're in healthcare or finance or whatever. I'd say run a small test first before going all-in on anything major.
Start with defining who owns what data and set up classification standards. Honestly, creating policies for data quality and access controls is harder than it sounds when you're dealing with massive datasets. Automated monitoring tools are your friend for tracking compliance - trust me on this one. Set up regular audits too. Oh, and make sure your governance committees include both tech people and business folks, otherwise you'll just talk past each other. My advice? Pick one important dataset first and build from there instead of trying to boil the ocean.
Honestly, the big stuff you gotta worry about is privacy violations and consent - like, companies are grabbing people's data without really asking properly. Then there's algorithmic bias, which is huge. They'll say "oh we're just making things better for users" but really they're being super invasive. People have basically zero control once their info gets collected. Discrimination happens when biased algorithms make decisions about jobs, loans, whatever. My advice? Set up solid data governance from day one. Also audit your algorithms regularly - catch that bias before it screws people over. It's way easier to fix upfront than deal with the mess later.
So real-time processing flips your data game completely - you're getting insights as stuff actually happens instead of waiting around for reports. Banking fraud detection is a perfect example where milliseconds matter. You can catch trends and weird patterns right when they pop up, not days later when it's too late. Honestly, going from reactive to proactive is night and day for customer experience. Your team stops playing catch-up all the time. I'd pick one solid use case first though - something where you'll see clear business results to show it's worth the investment.
You'll want Python and SQL first - those are like your bread and butter. Statistical knowledge is huge too since you need to actually understand what the numbers mean. Big data tools like Hadoop or Spark are good to know, though honestly the landscape changes every five minutes so don't stress about learning everything at once. Visualization stuff like Tableau helps when you're presenting to people who hate spreadsheets. Oh, and R is solid for stats work if you're into that. I'd just focus on Python/SQL basics first, then see what your job actually needs. Way easier than trying to learn everything upfront.
Get your baseline numbers locked down first - that's crucial. Then pick 2-3 KPIs that actually matter to your business goals and obsess over tracking them. Processing time, customer retention, cost reductions - whatever makes sense for you. Honestly, the hardest part isn't the measuring itself. It's figuring out what improvements came from your big data project vs everything else happening at your company (there's always something else, right?). Don't wait until the end to check progress - set regular checkpoints so you can course-correct if needed.
-
Excellent work done on template design and graphics.
-
Very well designed and informative templates.