
Big Data Analytics And Management Powerpoint Presentation Slides


Try Before you Buy Download Free Sample Product
 Impress Your
 Audience
Editable
of Time


Big Data is a massive collection of data that continues to increase dramatically over time. It is a data set that is so vast and complicated that no standard data management technologies can effectively hold or handle it. Here is a competently designed template on Big Data Analytics that provides details about the problems experienced by organizations to manage big data along with their solutions. It further highlights the top sources of big data, architecture, and workflow of extensive data management. This presentation covers sections for the different types of data, multiple resources of big data, working of big data, technologies, etc. It also comes with a ready-made checklist for big data management. Additionally, this PPT talks about the impacts of extensive data management on business processes and their benefits. Furthermore, this template includes a training program for comprehensive data management, budget planning, and big data applications in different sectors such as healthcare, education, automobile, finance, etc. Also, this PPT provides a 30-60-90 days plan and a roadmap for extensive data management. Lastly, this deck comprises a dashboard for comprehensive data management. Download the template now.
People who downloaded this PowerPoint presentation also viewed the following :
Content of this Powerpoint Presentation
Slide 1: This slide introduces Big Data Analytics. State Your Company Name and begin.
Slide 2: This is an Agenda slide. State your agendas here.
Slide 3: This slide shows Table of Content for the presentation.
Slide 4: This slide presents Table of Content highlighting Overview of Big Data Service Company.
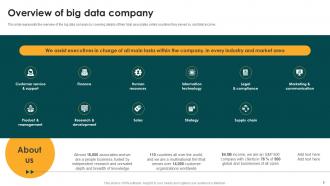
Slide 5: This slide shows big data company by covering details of their total associates, entire countries they served in, and total income.
Slide 6: This slide displays Table of Content highlighting Business Solutions We Provide for Big Data Management Problems.
Slide 7: This slide represents lack of knowledge and professionals and solution to this challenge that includes training and hiring of skilled professionals.
Slide 8: This slide shows Tool Selection for Big Data Management.
Slide 9: This slide presents challenge that is paying loads of money on hardware, new hires, software development, and its solution.
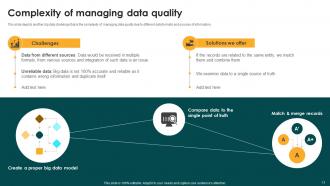
Slide 10: This slide depicts another big data challenge that is the complexity of managing data quality.
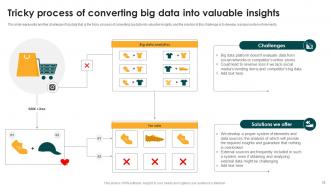
Slide 11: This slide displays Tricky Process of Converting Big Data into Valuable Insights.
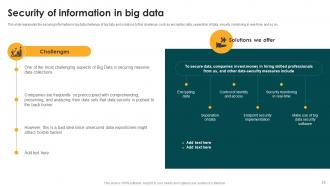
Slide 12: This slide represents securing information in big data challenge of big data and solutions to this challenge.
Slide 13: This slide shows Table of Content highlighting Let’s Discuss Big Data and Its Types.
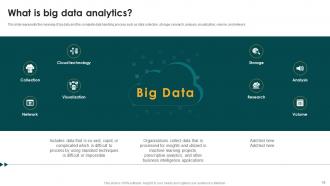
Slide 14: This slide presents meaning of big data and the complete data handling process.
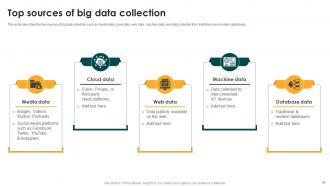
Slide 15: This slide shows top sources of big data collection such as media data, cloud data, web data, etc.
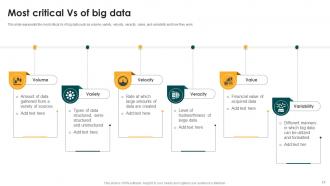
Slide 16: This slide displays most critical Vs of big data such as volume, variety, velocity, veracity, etc.
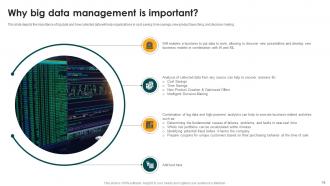
Slide 17: This slide represents importance of big data and how collected data will help organizations in cost-saving, time savings, etc.
Slide 18: This slide shows structured data type of big data and how data is kept in specific formats that are handled by machines only.
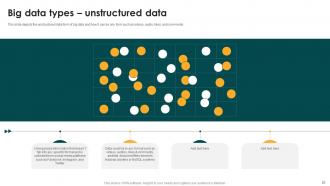
Slide 19: This slide depicts the unstructured data form of big data and how it can be any form such as videos, audio, likes, and comments.
Slide 20: This slide shows semi-structured data form of big data, and it contains both of the data forms, such as structured and unstructured data.
Slide 21: This slide displays Table of Content highlighting Architecture and Workflow after Big Data Management.
Slide 22: This slide represents Big Data Management Architecture for Business.
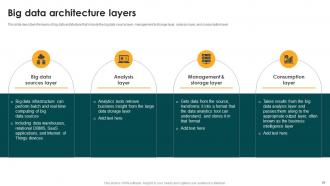
Slide 23: This slide describes the layers of big data architecture that include the big data source layer, management & storage layer, etc.
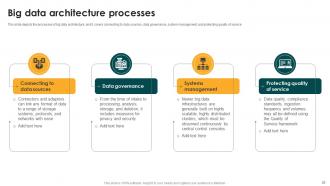
Slide 24: This slide presents the processes of big data architecture, and it covers connecting to data sources, data governance, etc.
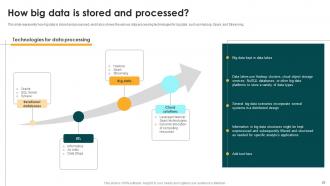
Slide 25: This slide shows how big data is stored and processed, along with various data processing technologies for big data.
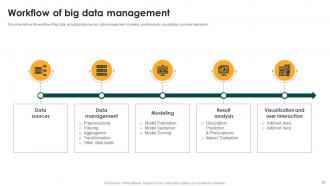
Slide 26: This slide displays the workflow of big data, including data sources, data management, modeling, etc.
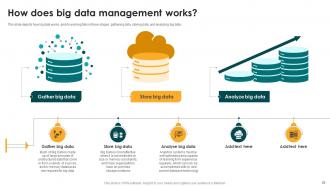
Slide 27: This slide depicts how big data works, and its working falls in three stages: gathering data, storing data, and analyzing big data.
Slide 28: This slide shows Table of Content highlighting Technologies and Strategies We Offer for Big Data Management.
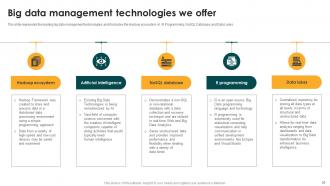
Slide 29: This slide presents big data management technologies, and it includes the Hadoop ecosystem, AI, R Programming, etc.
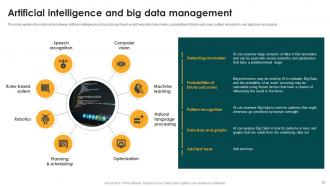
Slide 30: This slide explains the relationship between artificial intelligence and big data and how it would help detect anomalies, probabilities of future outcomes, etc.
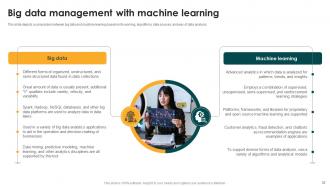
Slide 31: This slide displays comparison between big data and machine learning based on its working, algorithms, data sources, etc.
Slide 32: This slide represents Different Strategies We Use for Big Data Analytics.
Slide 33: This slide shows Table of Content highlighting Impacts and Benefits after Big Data Management.
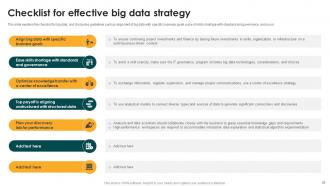
Slide 34: This slide presents checklist for big data, and it includes guidelines such as alignment of big data with specific business goals.
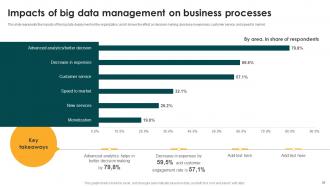
Slide 35: This slide displays Impact of Big Data Management on Business Processes.
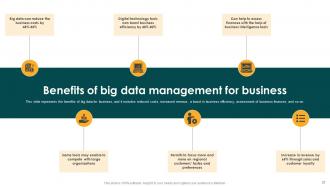
Slide 36: This slide shows Benefits of Big Data Management for Business.
Slide 37: This slide represents Table of Content highlighting Training and Budget for Big Data Management.
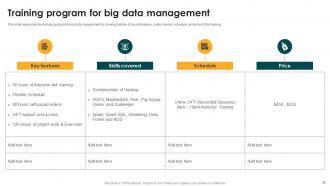
Slide 38: This slide shows training program for big data management by covering details of crucial features, skills covered, etc.
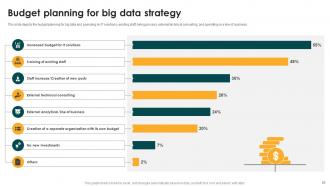
Slide 39: This slide presents the budget planning for big data and spending on IT solutions, existing staff, hiring process, etc.
Slide 40: This slide shows Table of Content highlighting Different Industries in Which We Manage Big Data.
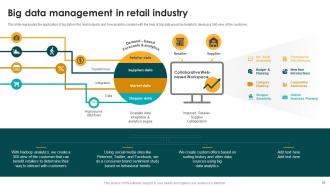
Slide 41: This slide displays application of big data in the retail industry and how analytics created with the help of big data.
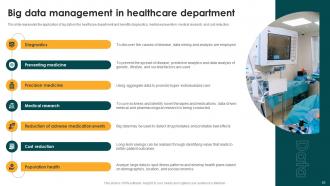
Slide 42: This slide represents the application of big data in the healthcare department and benefits diagnostics, medicine prevention, etc.
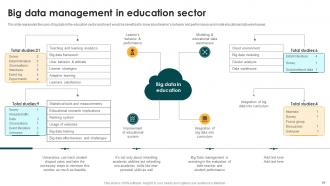
Slide 43: This slide shows Big Data Management in Education Sector.
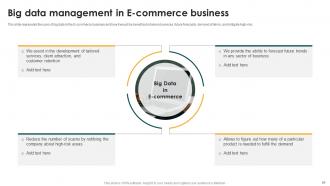
Slide 44: This slide presents Big Data Management in E-commerce Business.
Slide 45: This slide shows Big Data Management in Media and Entertainment Industry.
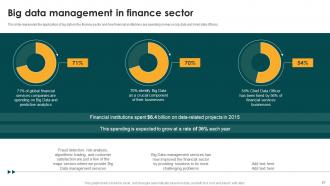
Slide 46: This slide displays application of big data in the finance sector and how financial institutions are spending money on big data.
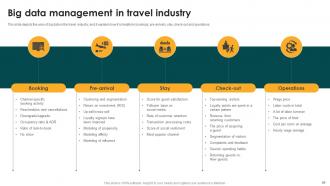
Slide 47: This slide represents uses of big data in the travel industry, and it explains how it is helpful in bookings, pre-arrivals, etc.
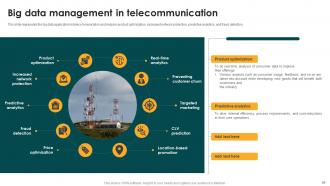
Slide 48: This slide shows big data application in telecommunication and helps in product optimization, increased network protection, etc.
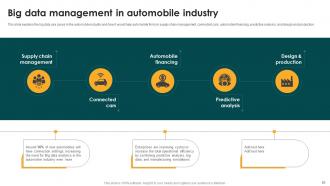
Slide 49: This slide presents Big Data Management in Automobile Industry.
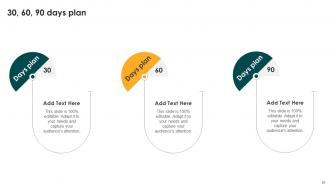
Slide 50: This slide shows Table of Content highlighting 30-60-90 Days Plan for Big Data Management.
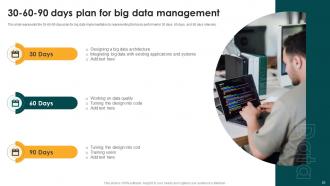
Slide 51: This slide displays 30-60-90 Days Plan for Big Data Management.
Slide 52: This slide represents Table of Content highlighting Roadmap for Big Data Management.
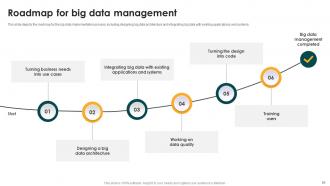
Slide 53: This slide depicts the roadmap for the big data implementation process, including designing big data architecture and integration.
Slide 54: This slide presents Table of Content highlighting Dashboard for Big Data Management.
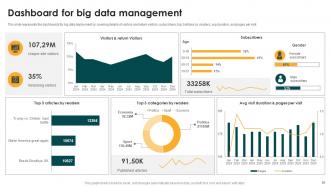
Slide 55: This slide shows dashboards for big data deployment by covering details of visitors and return visitors.
Slide 56: This slide displays Icons for Big Data (IT).
Slide 57: This slide is titled as Additional Slides for moving forward.
Slide 58: This slide shows Clustered Column-Line chart with three products comparison.
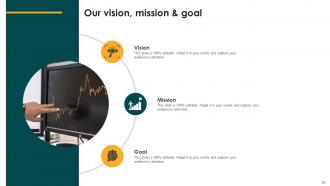
Slide 59: This is Our Mission slide with related imagery and text.
Slide 60: This slide shows Post It Notes. Post your important notes here.
Slide 61: This is an Idea Generation slide to state a new idea or highlight information, specifications etc.
Slide 62: This slide represents Venn diagram with text boxes.
Slide 63: This slide shows Puzzle with related icons and text.
Slide 64: This slide presents Pie Chart with data in percentage.
Slide 65: This is a Timeline slide. Show data related to time intervals here.
Slide 66: This is a Thank You slide with address, contact numbers and email address.
Big Data Analytics And Management Powerpoint Presentation Slides with all 72 slides:
Use our Big Data Analytics And Management Powerpoint Presentation Slides to effectively help you save your valuable time. They are readymade to fit into any presentation structure.


FAQs for Big Data Analytics And Management
Honestly, there's four things you gotta nail down for big data. Get your infrastructure sorted first - cloud storage, processing power, all that tech stuff that won't crash when you're dealing with massive datasets. Data quality matters too because garbage in, garbage out (trust me on this one). You'll need solid people - data scientists and analysts who actually know what they're doing, not just anyone with "analytics" on their resume. Oh, and make sure everything ties back to actual business goals. Like, don't just hoard data because you can. I'd start by figuring out what gaps you have now, then tackle the biggest ones first.
Honestly, real-time analytics is a game changer because you can catch problems while they're still small. Set up dashboards that ping you when something's off with your important metrics. The hardest part? Don't get lost in all the data noise - there's always tons of it. Pick the stuff that actually moves the needle for customers or revenue first. Oh, and definitely start with just one team or process. I learned this the hard way trying to do everything at once. Once you've got it working smoothly there, then roll it out wider.
Honestly, data quality is your worst enemy - everything's messy and nothing matches up between systems. Integration is a total nightmare too. Getting different platforms to actually work together? Good luck with that. Plus storage costs add up crazy fast if you're not watching them. Oh, and hiring people who know this stuff well costs a fortune these days. I'd definitely start with something small first. Like a pilot project or whatever. That way you can figure out what specific problems you're dealing with before diving into the deep end.
So basically, traditional analysis tells you what already happened - like last quarter's sales or whatever. Predictive stuff flips that around and tries to guess what's coming next using machine learning models. Both are useful honestly, but for different reasons. You'll still need regular analysis for most reporting work. But if you want to get ahead of things like customers about to quit or inventory running low, that's where predictive comes in handy. Worth testing some basic forecasting tools on data you already have.
So basically, big data helps you figure out what your customers actually want by tracking their behavior and purchase history. Pretty wild how you can predict their next move before they even think about it. Start with your best data sources first - don't try to do everything at once or you'll go crazy. Then you can customize product recommendations, tweak pricing for different groups, and personalize those marketing messages. Honestly, the whole customer journey mapping thing is where the magic happens. Pick one area to focus on initially though.
Look, you've got to nail three things: privacy, consent, and bias. Don't expose personal info or build detailed profiles without permission - it's honestly wild how much you can figure out from random data points. Check that people actually agreed to THIS kind of analysis, not just general data collection. Watch for algorithmic bias that screws over certain groups. Oh, and be upfront about what you're doing with their data. My take? Run regular ethics reviews with your team and always think "would I want someone doing this with MY stuff?" Trust me on this one.
Honestly, you've gotta build checks into every step - when you're collecting data, processing it, analyzing it, all of it. Automated validation is your friend here for catching incomplete or wonky data early. Don't let this become just IT's headache though - make it everyone's job or it'll never stick. Data profiling tools help spot weird patterns before they mess up your analysis. Oh, and actually enforce your governance policies instead of letting them collect dust! Start with your most important data sources first since you can't fix everything at once. Audit trails are clutch for tracking down where problems started.
So I'd probably start with Tableau or Power BI - most companies use these and they're pretty user-friendly. D3.js is amazing for custom stuff but honestly? It's a pain to learn. Python people usually go with matplotlib or Plotly, R folks are obsessed with ggplot2. Apache Superset and Grafana work great for huge datasets. Really depends on your budget and whether your team can code. I always tell people to try Power BI first since it's cheaper than Tableau but does basically the same thing.
So basically you drop ML algorithms right into your data pipelines and they automatically spot patterns in all that massive data. Way better than trying to manually dig through terabytes yourself - nobody's got time for that nightmare. You'll get real-time insights, anomaly detection, personalized recommendations, the whole deal. The cool part? More data actually makes these models smarter over time. Decision-making gets way faster too. My advice would be pick one specific use case first, see how it goes, then expand. Don't try to boil the ocean right away.
Dude, cloud computing is a total lifesaver for big data stuff. Instead of dropping crazy money on hardware, you just rent what you need. The auto-scaling thing is clutch - your data spikes and it handles it automatically. Most providers bundle their analytics tools together which honestly just works better. Processing terabytes used to take forever, now you're talking hours. Only paying for actual usage is pretty sweet too. If you're dealing with serious data volume (and I mean like, actually serious), definitely check out AWS or Azure's analytics packages. Google Cloud's decent too but I'm less familiar with their setup.
Yeah totally doable! Google Analytics and AWS QuickSight are solid starting points - Google Data Studio is actually free too. The cloud stuff handles all the technical headaches so you don't need your own servers or whatever. Pick one specific question first though, like why people bail on their shopping carts. Don't try analyzing everything at once, you'll just get overwhelmed. I've seen tiny businesses find crazy patterns they never noticed before. Start there, show it works, then expand. Way better than dropping tons of cash upfront on some fancy setup you might not even need.
Honestly, healthcare and finance are killing it right now - all that data actually saves lives and cash. Retail's doing great too with the whole personalization thing and supply chain stuff. Manufacturing surprised me though - turns out machines are super chatty about when they're about to break down, so predictive maintenance is huge. Transportation's obvious with self-driving cars and route optimization everywhere. Oh, and if you're thinking career moves or investments, definitely look for companies in these areas that are actually hiring data scientists, not just talking about it.
Set up your KPIs first - revenue growth, cost savings, stuff you can actually measure. The hard part? Figuring out what's really from your data work vs everything else happening (most teams honestly suck at this). Track the obvious wins like better sales from recommendations, but also things like how fast people make decisions now. Compare what you're spending on tools and people against real results over like 12-18 months. Oh, and document even tiny wins early on - you'll need those stories later when asking for more budget.
So you're gonna need both tech skills and people skills, honestly. SQL and Python are absolute must-haves - no way around it. Hadoop and Spark are good too, plus something like Tableau for making pretty charts. The crazy thing is how fast everything changes in this field, but those basics never go out of style. Communication matters more than people think though. You'll be explaining complex stuff to executives who just want the bottom line. Start with Python and SQL first, then pick one visualization tool and get really good at it. Oh, and R is solid too if you're more stats-focused.
Start with role-based access controls right away - seriously, don't put this off. People should only see what they need for their actual job, but companies screw this up constantly. Encrypt your sensitive stuff (both stored and moving around), and use data masking for test environments. Oh, and audit access regularly because Sarah from accounting who quit last month probably still has admin rights somewhere. First thing though? Classify your data by how sensitive it is. Everything else builds from there. I've seen too many places skip this step and regret it later.
-
Nice and innovative design.
-
Understandable and informative presentation.