


 0 Comment
 Customer Reviews

Effective communication is the backbone of any successful project, campaign, or organization. But how do you know if your communication strategy is truly working? Are your messages reaching the right audience? Are they sparking the desired action? The answer lies in communication plan metrics—the measurable indicators that reveal the performance and impact of your communication efforts.
From email open rates and social media engagement to message retention and stakeholder feedback, these metrics help you gauge what’s working and what needs improvement. For instance, a company launching a new product might use metrics to assess how well their internal teams are aligned or how effectively customers are receiving promotional messages. Without tracking these metrics, communication plans risk becoming mere guesswork.
However, monitoring and presenting communication metrics can be overwhelming without a clear, structured approach. That’s where SlideTeam’s Communication Plan Metrics Templates step in. These templates are designed to help you visualize and share your metrics effortlessly, making it easier to measure success, identify gaps, and refine strategies.
In this blog, we’ve handpicked the Top 10 Communication Plan Metrics Templates to save you time and ensure your presentations stand out. With ready-to-use designs and customizable features, these templates cater to diverse needs, whether you’re analyzing internal communications, external campaigns, or stakeholder engagement.
Let’s dive in and explore how these templates can elevate your communication strategy and drive meaningful results!
Template 1: Communication Plan Metrics PPT Set
This PowerPoint presentation provides a comprehensive overview of various organizational metrics, plans, and frameworks critical for effective management and operational efficiency. It covers a diverse range of topics, including internal communication plan metrics, employee engagement rates, and training communication effectiveness. The slides also delve into corporate communication strategies, business marketing metrics, and tools for tracking customer value and acquisition costs.
Key highlights include detailed frameworks for Agile Project Management Offices (PMO), operational workflows, security audit checklists, and dashboards for monitoring employee overtime and absenteeism. Additionally, the presentation emphasizes the importance of strategic alignment, governance, and success factors for PMO improvement alongside practical tools for maintaining workplace safety and tracking performance indicators.
With visually engaging layouts and actionable insights, this deck serves as a guide for managers and teams to align strategies, improve communication, and drive organizational success across diverse domains.
[product_image id=883798]
Template 2: Communication Metrics Dashboard
This PowerPoint presentation provides a detailed analysis of communication metrics across various organizational levels, focusing on employee engagement, satisfaction, marketing strategies, and enterprise program effectiveness. The slides include dashboards showcasing key data points such as engagement counts, departmental participation, email campaign performance, and brand value metrics. It highlights critical insights into employee turnover, adoption rates, and HR activities while offering a comparative analysis of key performance indicators (KPIs) over time.
Additionally, the presentation delves into the effectiveness of email communication, with metrics like email read rates, delivery statistics, and monthly email distribution trends. The marketing program slides outline performance benchmarks for sales targets, risk reduction, and market share growth, providing a clear view of current achievements versus goals. Designed to aid strategic decision-making, this presentation serves as a comprehensive tool for monitoring, analyzing, and improving internal and external communication efforts within the organization.
[product_image id=545944]
Template 3: Dashboard Snapshot for Risk Communication Planning and Key Metrics Tracking
This slide presents a comprehensive dashboard for Risk Communication Planning and Key Metrics Tracking. It includes a Risk Heat Map to visualize the residual likelihood and impact of risks, categorizing them into low, moderate, significant, and high levels. The Classification of Risks chart highlights the distribution of risks across tactical, operational, monetary, and compliant categories, aiding in prioritization.
Tactical Objectives metrics, such as availability, maximizing returns, and compliance, are outlined, showing their effectiveness in mitigating risks. A Controls Effectiveness pie chart provides insights into the effectiveness of implemented risk controls, differentiating between monthly and partially effective measures.
The dashboard also lists Critical Risks, comparing inherent and residual risk scores to highlight the impact of implemented measures. With detailed visualizations, this slide offers a clear and actionable framework for understanding, monitoring, and improving risk management strategies in an organization.

Template 4: Customer Communication Metrics Dashboard
This slide illustrates the Customer Communication Metrics Dashboard, focusing on the performance outcomes of a customer communication strategy. It evaluates metrics across three key areas: Sales Target, Risk Reduction, and New Market Share. Each section includes benchmarks, current performance, and goals, visually categorized as Below Target, At Risk, or On Target.
- The Sales Target section measures percentage increases in brand awareness and product knowledge. While brand awareness remains steady at the benchmark (9%), product knowledge lags behind at 3%, below the <4% target.
- The Risk Reduction section tracks reductions in brand distrust and brand switching. Both metrics are flagged as below target, with brand distrust at 13% against a 10% goal, and brand switching significantly higher at 22%, far from the 8% target.
- The New Market Share section highlights offline and online engagement growth. While offline engagement is close at 10% (goal: 21%), online engagement remains low at 7% (goal: 16%).
This dashboard provides actionable insights to realign communication efforts.

Template 5: Dashboard Snapshot for Email Communication Metrics
The Email Communication Metrics Dashboard provides a comprehensive overview of the performance of email marketing campaigns. Key highlights include 204 campaigns executed, reaching 257 total recipients. The average open rate stands at an impressive 65%, while the click-through rate is 18%, showcasing audience engagement levels.
The Engagement Distribution Timeline illustrates fluctuations in open and click rates over specific dates, with peak engagement at 78% open rate and 24% click rate around September 14. Insights into opens and clicks reveal 73 unique opens, 32 multiple opens, and a total of 168 opens, indicating significant interest. Similarly, clicks comprise 21 unique clicks and 32 multiple clicks, culminating in 168 total clicks.
Device-based engagement reveals that 85% of interactions occur on desktops, with 17% on mobile devices. This dashboard offers actionable insights for optimizing future email campaigns to drive higher engagement and clicks.

Template 6: Most Used Internal Communication Plan Metrics
The slide on Most Used Internal Communication Plan Metrics highlights critical KPIs to evaluate the effectiveness of communication within an organization. Key metrics include Employee Engagement Rates, which assess employee participation and interaction through KPIs like readership and social metrics such as shares and comments. Page Visits and Logins analyze unique page views, bounce rates, and daily conversions, providing insights into content accessibility and engagement levels.
The Employee Feedback metric facilitates two-way communication, leveraging surveys to gather employee opinions and improve internal strategies. Lastly, a focused metric on Employee Retention Rates evaluates the percentage of employees actively engaged within the organization, offering a deeper understanding of organizational loyalty and satisfaction.
Together, these metrics serve as a comprehensive toolset to refine communication strategies, promote active participation, and ensure a well-informed workforce aligned with organizational goals.

Template 7: Communication Plan Metrics to Employees Up-to-Date
This slide on Communication Plan Metrics to Keep Employees Up-To-Date outlines the structured approach to keeping team members informed and engaged throughout project processes. It details various communication methods, their purposes, mediums, frequency, and the respective target audience.
For instance, a Kickoff Meeting is conducted in person to introduce the project and its objectives, involving project sponsors, and occurs once. Regular Project Team Meetings provide weekly updates on project status, using face-to-face or virtual mediums, and are attended by the project team. Creative Design and Technical Meetings are held as needed to address design or technical challenges, targeting technical teams in a collaborative setting.
Additionally, Project Status Meetings and Reports ensure leadership and stakeholders are informed monthly via conference calls or emails about progress, costs, and performance. This structured communication framework ensures clarity, alignment, and active participation from all relevant stakeholders.

Template 8: Employee Training Communication Plan Metrics
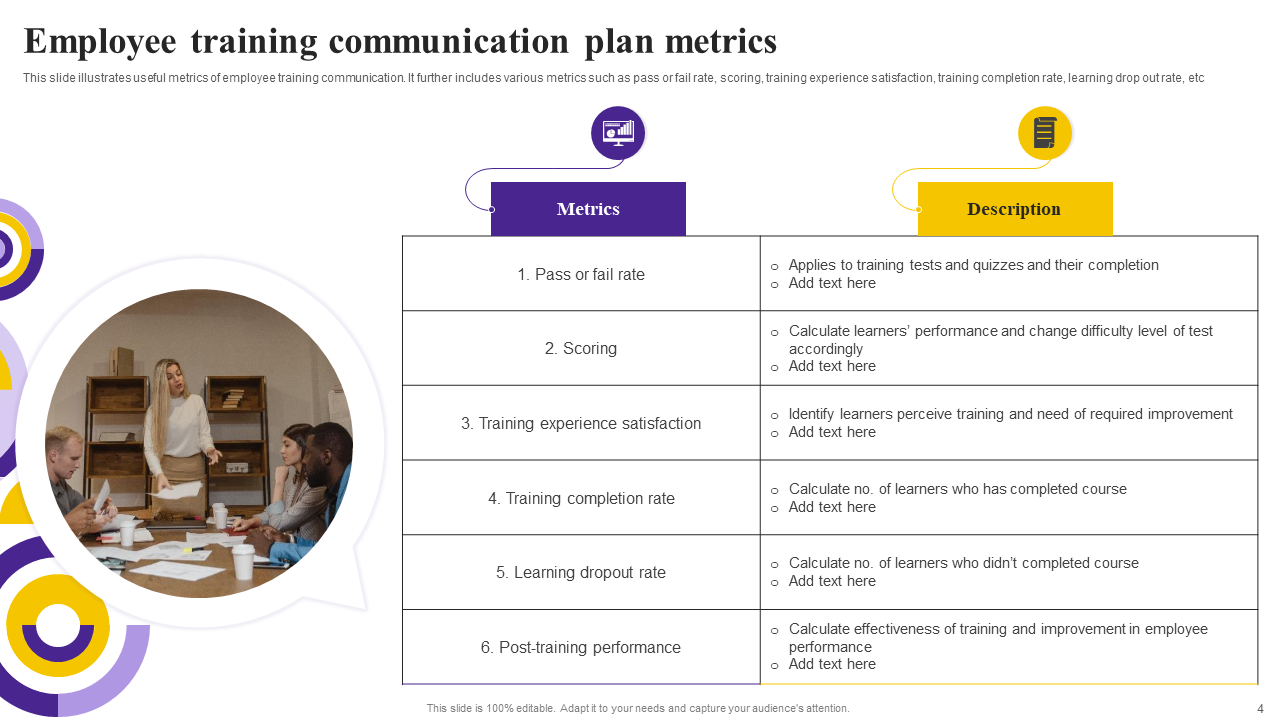
This slide on Employee Training Communication Plan Metrics highlights essential KPIs to evaluate the effectiveness and efficiency of training programs. The metrics include:
- Pass or Fail Rate: Tracks training test and quiz completion to measure basic learning outcomes.
- Scoring: Analyzes learner performance and adjusts test difficulty for better skill assessments.
- Training Experience Satisfaction: Collects feedback on training quality, identifying areas needing improvement.
- Training Completion Rate: Measures the number of participants successfully completing the program.
- Learning Dropout Rate: Tracks participants who failed to complete the training, pinpointing engagement issues.
- Post-Training Performance: Evaluates the application of acquired skills in real-world scenarios, reflecting training impact.
These metrics provide comprehensive insights into the training process, ensuring it aligns with organizational goals while addressing employee development needs effectively.
Template 9: Useful Corporate Communication Plan Metrics
This slide on Useful Corporate Communication Plan Metrics outlines key performance indicators (KPIs) to assess the effectiveness of communication strategies within an organization. The featured metrics include:
- Open, Read, and Click Rates: These metrics monitor employee engagement through email and text communications. By tracking event sign-ups, message interactions, and read rates, organizations can identify effective outreach strategies and refine content delivery.
- Corporate Video Views: Evaluates the performance of corporate communication videos based on play rates and view counts. Data collection spans various intervals—monthly, quarterly, etc.—to gauge the impact and reach of video campaigns.
- Staff Intranet Peak Times: Monitors employee log-ins to the company’s intranet to identify peak traffic periods. This metric helps optimize communication delivery and platform functionality during high-usage times.
- Mobile Usage Levels: Tracks the extent of mobile device utilization for corporate communication, such as the percentage of emails accessed on mobile devices. This metric highlights mobile engagement trends, enabling organizations to optimize mobile-first strategies.

Template 10: Business Marketing Communication Plan Metrics
The Business Marketing Communication Plan Metrics slide highlights key indicators for assessing marketing effectiveness. It provides an overview of metrics crucial for understanding customer behavior, cost-efficiency, and campaign impact.
- Customer Lifetime Value (LTV): Measures the total revenue generated by a customer during their relationship with the company, helping to evaluate long-term profitability.
- Customer Acquisition Cost (CAC): Assesses the cost of acquiring new customers by dividing total acquisition expenses by the number of new customers gained.
- Web Traffic: Tracks the number of visitors to the company website, including metrics like user sessions, unique visits, and source breakdowns.
- Lead Conversion Rates: Calculates the percentage of leads that convert into paying customers, offering insights into sales funnel effectiveness.
- Inbound Marketing ROI: Evaluates the return on investment for inbound marketing strategies by comparing revenue to expenditure.
- Social Media Traffic: Measures the influence of social media campaigns, focusing on engagement metrics such as likes, shares, and click-through rates.

Template 11: Email Marketing Communication Plan Metrics
The Email Marketing Communication Plan Metrics slide emphasizes essential metrics that evaluate the effectiveness of email campaigns. It focuses on three critical areas:
- Delivery Rates: This metric calculates the percentage of emails successfully delivered to recipients' inboxes. A high delivery rate indicates efficient list management and effective targeting, while a low delivery rate highlights potential issues like outdated email addresses or spam filtering, signaling the need for list refinement.
- Open Rates: This metric tracks the percentage of recipients who open an email after receiving it. A high open rate reflects compelling subject lines and effective timing, whereas a low rate suggests the need for optimization in email content or targeting strategies.
- Click-Through Rates (CTR): This measures the percentage of email recipients who clicked on a link within the email. High CTR demonstrates engaging content and clear calls-to-action, while low CTR highlights areas needing improvement in content relevance or design.
These metrics guide campaign adjustments for better audience engagement and conversion.

Measure What Matters, Communicate with Impact
If you’re not tracking communication metrics, you’re flying blind in a world where clarity and alignment are everything. Metrics aren’t just numbers—they’re the story of your communication strategy’s success, showing what’s resonating and what’s falling flat.
With SlideTeam’s Top 10 Communication Plan Metrics Templates, you can turn that story into a compelling narrative. These templates help you showcase results, highlight areas for improvement, and refine your approach with confidence. Ready to stop guessing and start communicating smarter? Let’s make every message count!