


 0 Comment
 Customer Reviews

Think about an engineering team as the engine room of a large ship. Engineering is powering everything, problem-solving under pressure, operating and fine-tuning the systems that other people do not even know exist. So what happens when the people driving the ship (stakeholders, decision-makers, or even other departments) have no idea what happens in the engine room? That's when the wheels start to fall off. Data stays buried. Progress stays hidden. The engineering team shines bright, yet the world may see them as invisible.
That is precisely why engineering dashboards are crucial. Dashboards are not simply just a bunch of charts and colors jammed into some tiles on a screen - they are the translator for raw data and real-world impact. They tell a story about everything from performance to bottlenecks, efficiency in cost, timelines, and everything else you do not want to be lost in a 50-tab spreadsheet. And yet, as critical as dashboards are, dashboards in the engineering sector are often treated like an after-thought.
Refer to our blog on Top 10 Production Dashboard Templates to provide you with production visibility while reducing errors.
Here’s the kicker: lots of engineering teams want to start using dashboards but hit a brick wall in executing them. It could be because of constraints on design resources, the technical complexity, or somehow directionally lost and don’t know how to start. In the end, they’re left with inconsistent reporting, off-chart communication and wrong decision making.
Enter SlideTeam’s “Top 10 Engineering Dashboard Templates”. Your next - gen solution! Our templates are turnkey applications for engineers that want to spend their time engineering—not fussing with design. Our frameworks cover everything from your engineering analytics, engineering reports, user interface design, data-driven decision making, technical dashboards, business intelligence tools to more. Each template is fully editable, user and content friendly. Plus, each template can be downloaded in both PNG and JPG formats.
Don’t let your hard work go unnoticed, and start telling your engineers stories about your information in the way it deserves. Check out our power packed templates and get back to what you do best!
Get to our blog on Top 10 Software Dashboard Templates to facilitate data engagement and foster a proactive approach to business challenges.
Template 1: Social Engineering Methods And Mitigation Social Engineering Attacks Tracking Dashboard
This presentation slide provides a quick visual overview of cyber attacks over a specific period. A dashboard that helps the teams to track, examine and alleviate the social engineering attacks all in real time. Data visualization helps in identifying trends, understanding attack regularity, and identifying most common threats. The slide aids in strategic planning by showing the locations and timings of attacks. Download it now.

Template 2: Social Engineering Attacks Tracking Dashboard Social Engineering Attacks Prevention
This PPT Slide provides a scannable Visual format of cyber threats. lt help you identify patterns across campaigns, pages, and hack attempts. High level performance metrics such as health risk, attack vectors, and risk review present to security teams to understand the level of concern in terms of software vulnerabilities along with the effectiveness of their response. It promotes timely action and supports more effective resource allocation. Download now.

Template 3: Computerized Maintenance Engineering System Dashboard PPT Template
This PPT Theme assist with prediction-based maintenance planning. It ensures that the businesses are updated with extensive tasks and operational needs. It provides a snapshot of engineering metrics such as planned compliance, completion of overdue work, and work orders by priority. It highlights open work requests and the current backlog which helps maintenance teams prioritize effectively. It helps to maintain seamless operations and reducing downtime/maintenance delays. Get it now.

Template 4: Construction Project Engineering KPI Dashboard PPT Template
This presentation theme enables engineering teams to see the status of work, progress, and performance in real-time. It contains important information such as project stages, %complete, elapsed time, and cost variance. This KPI Dashboard helps better decision making by letting stakeholders compare actual progress with the planned timelines and budgets to take timely corrective actions. It keeps the construction activities on track. Get it now.

Template 5: Product Engineering And Development KPI Dashboard PPT Template
This presentation template gives an overview of software development metrics for improving the efficiency of product development. It shares information about the product development team, such as average result area scores and key result areas. It enables stakeholders to measure the objectives on whether the teams are performing on par or need productive improvements. It helps autonomous and informed decisions that foster innovation and simplify engineering efforts. Download it now

Template 6: Dashboard To Measure Project Engineering And Construction Services Performance
This PowerPoint Slide provides a high level metric snapshot for key parameters that assess engineering performance. It features not just KPIs such as name, efficiency, cost, cycle time, and state of the project. It also features comparison between actual vs planned resources and annual vs planned budget to help teams catch variances way before time. This graphical tool helps project managers determine if E&C services are tracking on time and on budget. Get it now.

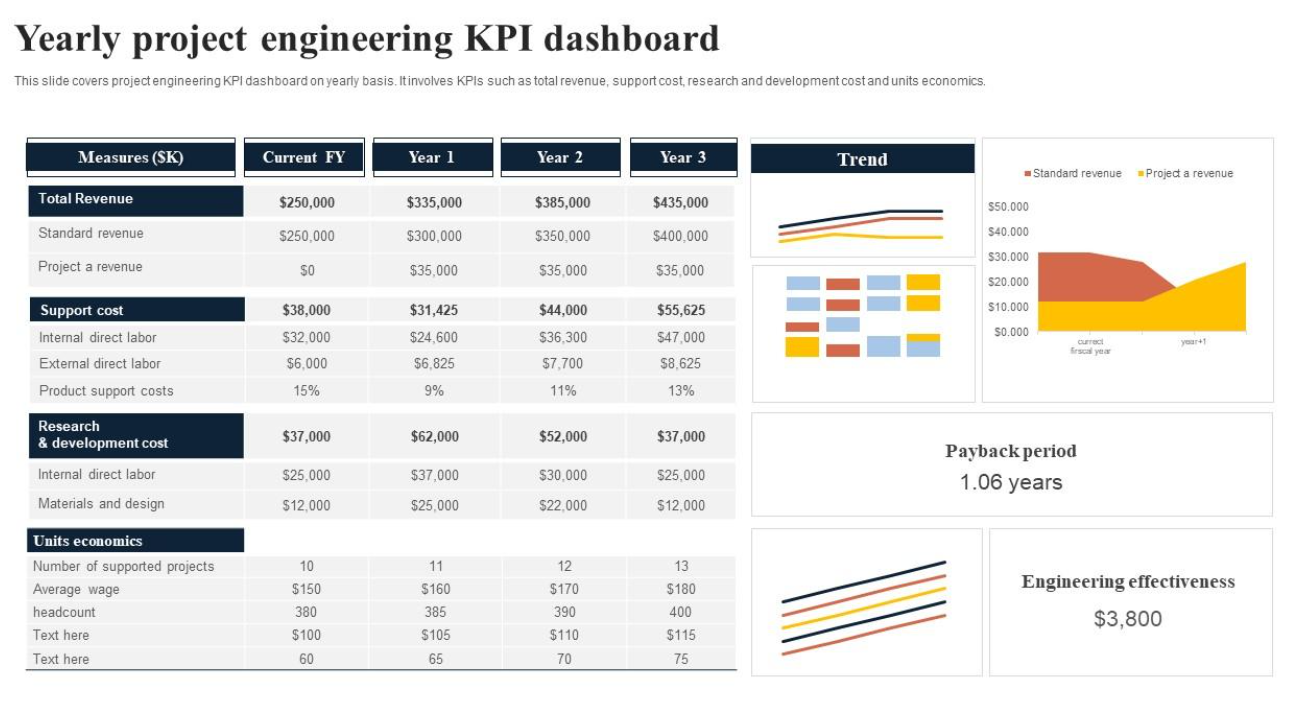
Template 7: Yearly Project Engineering KPI Dashboard PPT Template
This PowerPoint Template covers key information like total revenue, cost to support, cost of research and development, and unit economics. Stakeholders can use this dashboard to analyze the financial and operational efficiency of engineering projects on an annual scale. It allows for informed planning and resource allocation by visualizing trends and shifts in performance. Download it now for smarter annual planning, improved project results, and stay ahead.
Template 8: Monthly Project Engineering KPI Dashboard PPT Template
This presentation slide provides a high-level view of engineering insights to track the performance of a project. It contains data points like budget of the projects, the work done, overdue tasks and further progress related to testing, design and development phases. For engineering managers hoping to gauge existing momentum and see where work is falling behind or stuck, this dashboard is a useful tool. Claim it now.

Template 9: Cloud Engineering Dashboard To Monitor Resources PPT Template
This PPT Slide offers dashboard software for managing your cloud infrastructure systems. It has project summary, resource utilization, health checks, number of running instances, user activities, alerts, unused access as KPIs. This shifts the dashboard as per the needs of cloud engineering teams from a historical state to a real-time monitoring the performance, security, and utilization of cloud resources. It enhances access control and minimizes potential access. Download it now.

Template 10: Engineering KPI Dashboard For Measuring Performance PPT Template
This PPT Framework provides a snapshot of engineering workflow. Includes cycle time broken down by CI/CD, commit volume per risk category and what activities you focus on. This dashboard enables engineering leaders to track the pace at which teams are progressing through development. It helps identify the bottlenecks and points of focus. It aids data-driven decisions so teams can always align with delivery goals. Download it now.

Work as an Engineer: Smarter, Not Harder!
Data is king, and in engineering, it is everything. With dashboards, teams can focus on accuracy, efficiency, and accountability — whether that means navigating the complexities associated with design projects or monitoring equipment performance. Dashboards convert numbers into intelligence that can be acted upon to ensure projects are on track, problems are identified early, and decisions are made based on data, rather than in real-time.
Our Top 10 Engineering Dashboard Templates are strategic tools of use. From products underdevelopment to quality assurance, maintenance schedules, agile project management or manufacturing KPIs, these dashboards provide an easy-to-digest aggregated view of operations.
The benefits? Less errors, more optimal use of resources, clearer communication, team collaboration and above all, higher project success rates.
Get our Engineering Dashboard templates that let you infuse clarity, control, and confidence into every stage of engineering system performance!
PS: Don't miss our blog on Top 10 Manufacturing Dashboard Templates to help you manage manufacturing problems, reduce errors, and get production insight.
Engineering Dashboard FAQs
1. What are the three types of dashboards?
There are three primary types of dashboards:
Operational Dashboards – These monitor activities and processes in real time, making it easy for teams to keep an eye on their daily operations (i.e. order processing, inventory levels).
Analytical Dashboards – For data insights and trends over time, mainly to look at comparisons, patterns, and deeper insights.
Strategic Dashboards – High-level KPIs focused on organizational long-term goals to help executives make better-informed strategic decisions
2. What is a dashboard and example?
Dashboard: A dashboard is a visual interface that presents users with key data points and metrics so they can monitor performance and take action.
For example, a supply chain custom dashboards can display stock levels, order status, lead times of suppliers, and delivery performances; providing managers with an at-a-glance summary of the efficiency of every aspect of their supplier management.
3. What is KPI in engineering?
In engineering, a KPI (Key Performance Indicator) is a metric that quantifies the status of a specific business process and is used to determine how well engineering processes (or a team) are performing against a set goal.
Examples include:
Equipment uptime percentage
Project delivery timelines
Mean time to repair (MTTR)
Count of design mistakes or reworks
KPIs track performance, allow for efficiency improvements, process optimization and inspire data-driven changes in engineering processes.