





 0 Comment
 Customer Reviews

In pharma, even a decimal point can make the difference between a breakthrough and a blunder.
When you are managing drug development, regulatory compliance, supply chains, clinical trials, and sales forecasts (often all at once), there’s no room for ambiguity. Every data point must be accounted for, every trend tracked, every anomaly flagged. And doing that across spreadsheets, systems, and silos? That’s a prescription for chaos.
What the industry needs is a central nervous system for operations; a pharmaceutical dashboard that integrates R&D, QA, manufacturing, and market performance into a single, clean, visual command center.
To make things simple, SlideTeam offers a selection of Pharmaceutical Dashboard Templates. These 100% editable and customizable PowerPoint presentations will assist you in tracking important metrics at each stage, including clinical trials, regulatory submissions, inventory, and distribution schedules.
Let's explore the templates now!
Check our blog on the Top 10 Clinical Dashboard Templates for more on the topic.
Template 1: Dashboards Related to Patients of Pharmaceutical Company
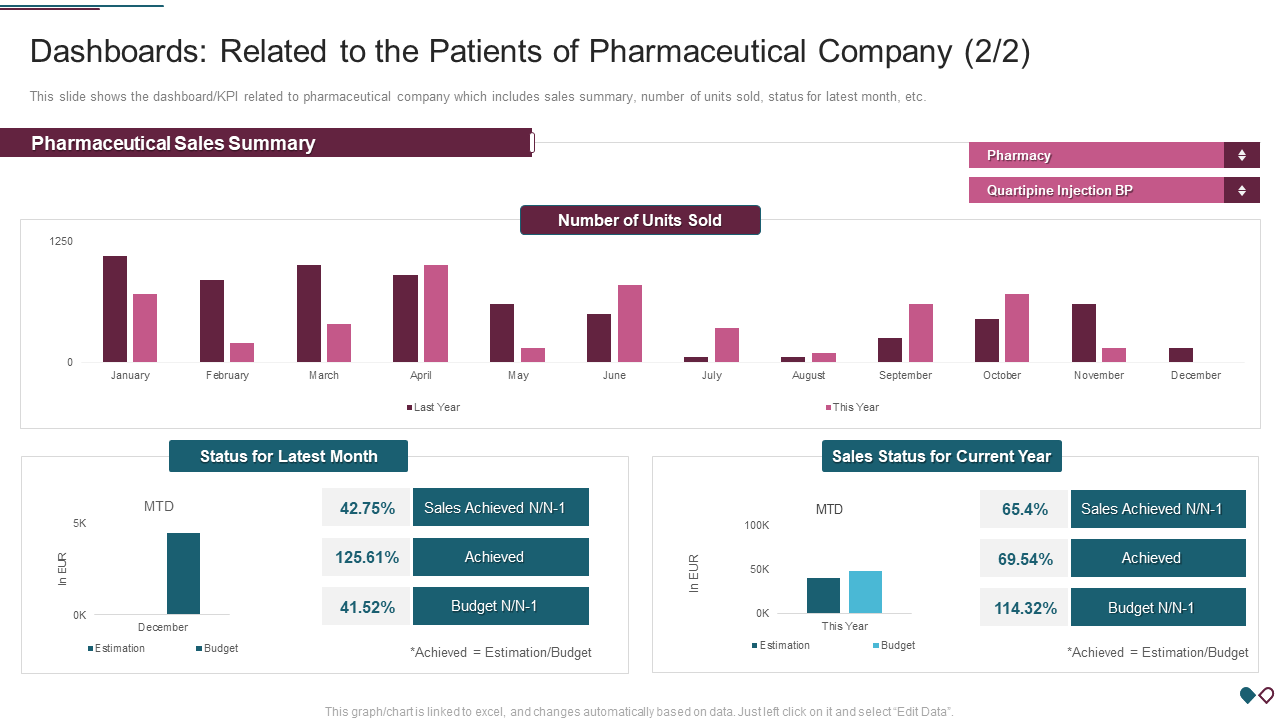
This PPT Slide presents a sales dashboard of a pharmaceutical company, which is concentrated on performance indicators, including monthly unit sales, sales comparison with the previous year, and the ratio of achievement. It has a comprehensive Pharmaceutical Sales Summary with bar charts of the trends. The bottom section offers the most important information about the recent month and the current year, including such metrics as sales made (N/N-1), percentage of achievement, and budget compliance. The visual representation of the estimate versus actual performance, the use of dual-axis graphs and KPIs, provides stakeholders with clarity on the effectiveness of operations, accuracy of the forecast, and the overall sales effectiveness of Quartipine Injection BP in the pharmacy category.
Template 2: Pharmaceutical Quality Assurance and Control Dashboard
This PPT Dashboard offers an overview of the drug production performance. It discusses the main points such as lead time, cost summary, production quality, and quality metrics. Bar charts show the time and cost allocation of the planning, manufacturing, and inspection of different drugs. The main gauge shows the overall quality of production as 91.22 percent. LAR (Lot Acceptance Rate) and PQGR (Product Quality Grading Ratio), complaints, and takt time are presented in detailed tables. Also, there is a production quality table that compares target vs. produced units, quarter by quarter. This dashboard can be used to monitor the efficiency of operations and maintain uniformity in the standards of products in pharmaceutical manufacturing.

Template 3: Drug Development Dashboard for Pharmaceutical Industry
This PPT Set identifies the major performance indicators that are associated with quality, production goals, cost, and lead time. It contains extensive tables of drug comparison based on LAR (Legally Acceptable Representative), PQCR (Product Quality Complaint Rate), and takt time. A comparison between production and target shows performance in quarters of various syrups. Drug lead time (in hours) and manufacturing cost breakdowns are also visualized in the dashboard. A large gauge shows that the rate of production quality is 92.22%, which means that the standards are highly observed. The dashboard is best suited for monitoring the progress of drug development, quality control, and operational efficiency in the pharmaceutical manufacturing process.

Template 4: Pharmaceutical Store Dashboard after Implementing Sales Plan
This PPT Preset measures how a sales plan affects performance measures, including gross and net sales, top revenue generators, and channel sales. The first section compares the monthly trends in gross and net sales, showing performance gaps. Bar charts specify net sales by product and show the best revenue generators. Retail Pharmacies and Wholesalers are revealed as strong sales channels by channel analysis. The dashboard assists stakeholders in determining which sources and products generate the best returns, evaluating the degree of alignment with targets, and planning how to improve. It is perfect to monitor the success of the sales initiatives undertaken and improve the prospective sales strategy in pharmaceutical business.

Template 5: KPI Sales Dashboard of Pharmaceutical Automation
This PPT Dashboard presents the full picture of the performance indicators in managed care, payer type, and promotional efforts. It monitors branded prescription performance (TRx and NRx) on a territory, district, and national basis. The distribution of payer type is presented in the form of pie charts that emphasize the dominance of the third party. Promotional measures of visit, reach, frequency, and call plan compliance are measured along with comparisons of attainments. Alerts classify prescribers as either positive or negative contributors depending on TRx changes and plan adherence. This dashboard can help pharmaceutical teams to track field activity, make the most of promotional strategies, and make data-driven decisions to achieve better sales results.

Template 6: Quality Control Dashboard for Pharmaceutical Manufacturing Industry
This PPT Slide shows the most important performance indicators that will help to monitor and enhance the standards of production. It has visual information about drug lead time (planning, manufacturing, and inspection), a summary of manufacturing costs at various stages of development, and the quality of production is displayed at 91%. The quality metrics table monitors LAR (Legally Acceptable Representative), PQCR (Product Quality Complaint Rate), and takt time of each drug. The production vs. target table also shows quarterly performance of different syrups so that it can be compared with the anticipated output. This dashboard provides quality managers with practical information to improve efficiency, reduce complaints, and ensure regulatory compliance.

Template 7: KPI Dashboard to Track Pharmaceutical Marketing Progress
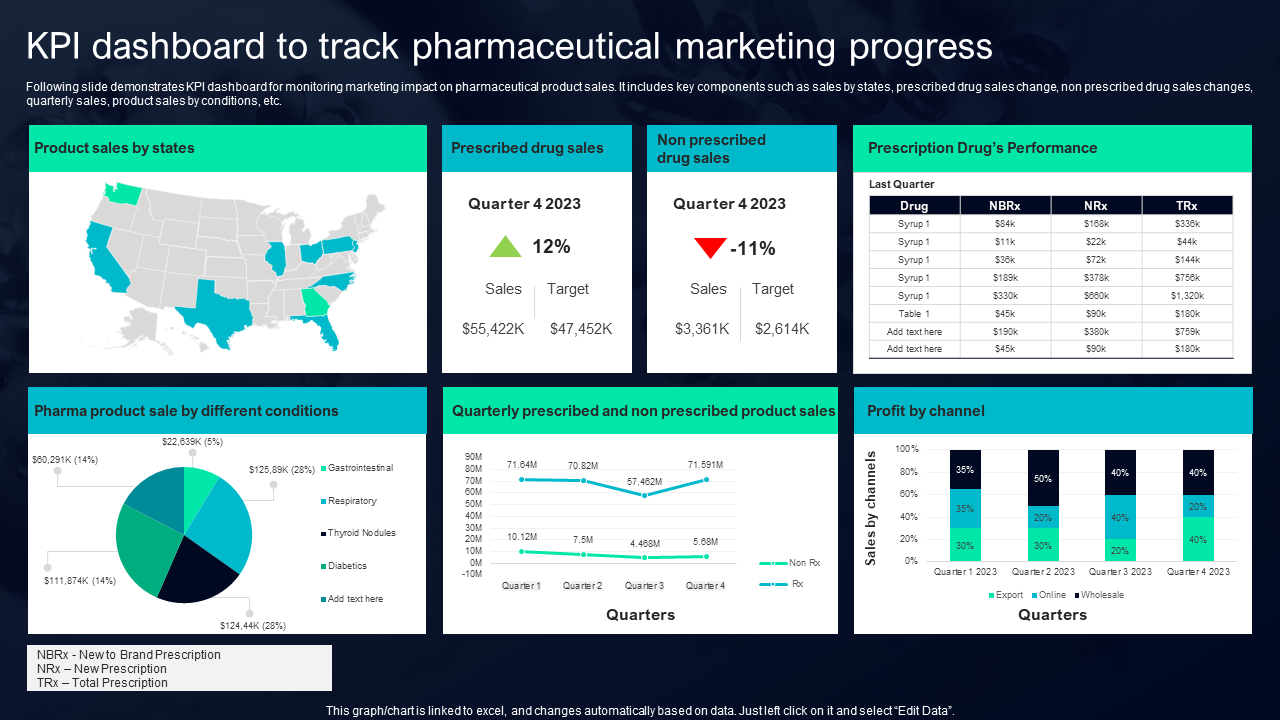
This KPI Dashboard monitors the performance of pharmaceutical marketing on various levels, providing a clear picture of sales development and strategic influence. It contains product sales by state, changes in prescribed and non-prescribed sales, and quarterly trends in sales. Prescription drug performance data is detailed with NBRx, NRx, and TRx figures. A pie chart is used to divide sales by medical conditions, such as gastrointestinal and respiratory problems. Also, profit by sales channel, export, online, and wholesale, is monitored on a quarterly basis. This dashboard can help pharmaceutical marketers to determine sales hotspots, channel performance, and product demand by condition, and can inform data-driven marketing strategy and sales forecasting.
Template 8: Pharmaceutical Quality Assurance and Control Dashboard
This PPT Slide offers a holistic view of drug production performance. It presents critical KPIs such as lead time of drugs, production quality percentage (90.22%), and cost summaries across planning, manufacturing, and inspection stages. Quality metrics cover parameters like LAR, complaint counts (PQCR), and task times for syrups and tablets. The dashboard also tracks production targets versus actuals across multiple quarters, helping identify output gaps. With structured visuals and color-coded indicators, this dashboard is ideal for pharma teams aiming to monitor compliance, enhance process efficiency, and maintain product quality across manufacturing operations.

Template 9: Pharmaceutical Sales Project Quarterly Performance Dashboard
This quarterly performance dashboard presents a detailed analysis of the pharmaceutical sales data. It covers parameters like sales performance by region, trend in prescribed and non-prescribed drugs, and important drug performance indicators such as NBRx, NRx, and TRx. A pie chart represents sales according to health conditions, with such segments as diabetes, cancer, and heart conditions. The line chart is used to monitor the quarterly changes in Rx and non-Rx sales, whereas the bar chart shows the contribution of profits by the channel, such as export, online, and wholesale. This dashboard will help pharma companies identify the best-selling drugs, assess the performance of channels, and make evidence-based decisions regarding market strategy and sales planning.

Template 10: Pharmaceutical Company Patient Analysis Dashboard
This dashboard offers a detailed report on the pharmaceutical sales performance with emphasis on monthly and annual developments. It contrasts budgeted estimates and actuals and displays the most important indicators, such as sales accomplishment percentages and YTD goals. In the left panel, the monthly sales status is presented in December, along with the breakdowns of budget, estimation, and achievement. The right panel monitors the annual performance with a focus on the overall achievement rates. An elaborate bar chart at the bottom shows the units sold for every month of the current year and the previous year, providing a comparative analysis of the market trends. This layout assists the stakeholders in tracking targets, maximizing forecasting, and assessing the efficiency of product sales in the long run.

Because in Pharma, Guesswork Isn’t an Option
In a high-stakes industry like pharmaceuticals, every decision—whether it’s about supply chains, clinical progress, or compliance—must be backed by data that’s current, clear, and actionable. There’s no room for dashboard drama or analytics ambiguity.
This is why SlideTeam Pharmaceutical Dashboard Templates are designed to provide structure, speed, and precision. These templates will assist you in monitoring KPIs, bottlenecks, and reporting results, all the time remaining consistent with your business and regulatory objectives.
Simply enter your figures, and the design will tell the story. Get these templates today!
FAQs
1. What is a pharmaceutical dashboard, and what is its purpose?
A pharmaceutical dashboard is a graphical representation of the most important performance indicators (KPIs) and data of the pharmaceutical industry, which aims to give real-time information and help in decision-making. It is a centralized mechanism of tracking different elements of the business, including clinical trials, drug safety, supply chain, and financial performance.
2. Which departments benefit most from it (R&D, sales, compliance, etc.)?
Although every department may indirectly gain from these dashboards, Research & Development (R&D) is the main beneficiary since it leads to innovation, development of new products, and processes. Sales and Marketing also gain a lot because they have new, innovative products to sell and market. Compliance is also a beneficiary since more efficient and effective compliance solutions can be developed as a result of R&D.
3. What key metrics should it track?
The metrics that should be monitored in a pharmaceutical dashboard are productivity, quality, financial, and customer satisfaction. This comprises measures such as efficiency in production, advancement of drugs, performance in sales, and adherence to regulations.


