


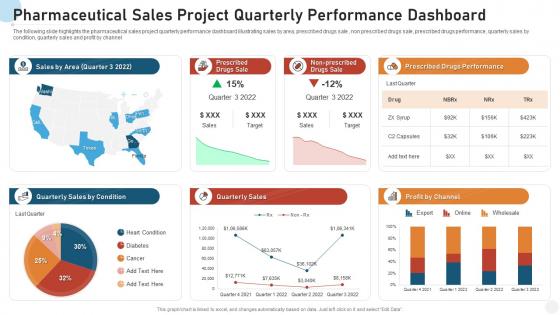
Pharmaceutical sales project quarterly performance dashboard




Try Before you Buy Download Free Sample Product
 Impress Your
 Audience
 100%
100% Editable
 Save Hours
 of Time


Our Pharmaceutical Sales Project Quarterly Performance Dashboard are topically designed to provide an attractive backdrop to any subject. Use them to look like a presentation pro.
People who downloaded this PowerPoint presentation also viewed the following :
Pharmaceutical sales project quarterly performance dashboard with all 7 slides:
Use our Pharmaceutical Sales Project Quarterly Performance Dashboard to effectively help you save your valuable time. They are readymade to fit into any presentation structure.





FAQs for Pharmaceutical sales project
Start with revenue stuff - total sales, growth rates, how you're hitting targets by product and region. Sales rep numbers are really important too: daily calls, conversion rates, quota performance. Market share is amazing data if you can actually get your hands on it (pharma data can be such a pain sometimes). Pipeline health matters a lot - leads, deal stages, average sizes. Oh, and patient metrics like prescription volumes and adherence rates. Honestly, nail these basics first and you can always layer on more specific tracking later.
Dude, visualization beats staring at endless spreadsheets any day. You'll catch underperforming territories instantly, spot seasonal prescription patterns, and see which reps are actually crushing it. Those geographic heat maps? Total game-changer – seriously, you'd miss so many market opportunities without them. Plus explaining stuff to higher-ups becomes way easier when everything's visual. Oh, and set up automated dashboards for your main metrics so you're not stuck pulling reports manually every damn week. Trust me on this one.
Dude, real-time data is seriously a total game-changer for pharma dashboards. Your reps can actually pivot mid-quarter when they see what's working (or not working). Instead of waiting weeks to realize there's an inventory problem, you'll catch it right away. Territory management becomes so much easier when you're not flying blind with old data. I mean, think about it - would you rather make decisions based on last month's numbers or what's happening right now? Your team can shift resources where they're actually needed instead of guessing. Just figure out which metrics truly need live updates vs daily refreshes first.
Dude, connecting your CRM to your pharma dashboard is a game changer. All that physician data flows in automatically - no more spreadsheet hell. You'll see which doctors actually respond to your outreach and track prescription patterns in real time. Cross-selling opportunities become super obvious too. The coolest part? You can spot prescribing trends and pivot your strategy on the fly. Honestly, I wish I'd done this sooner - would've saved me like 5 hours a week just on data entry alone. Hook up that API connection first thing.
Honestly, start with what your sales team actually cares about - revenue by territory, how products are performing, pipeline health. That stuff goes front and center. Don't go crazy cramming every chart possible onto one screen (seriously, I've watched so many cluttered dashboards just collect dust). Clean layout with logical groupings works way better. You'll want drill-down capabilities from big picture to detailed views, and stick with consistent colors throughout. Oh, and test it with real sales reps first - they'll catch the stuff you missed and tell you what KPIs they're actually using day-to-day.
So basically, predictive analytics takes your old sales data plus market trends and external stuff (like seasonal changes or new regulations) to forecast what's coming next. You'll be able to see which products might suddenly spike in demand or where supply chain issues could hit. Honestly, the accuracy is pretty wild once you have enough data flowing in. The models crunch everything - prescription patterns, demographic changes, all of it. Oh, and definitely start with clean historical data for your KPIs first. That's gonna make your forecasts way more solid from the get-go.
Focus on revenue per territory first, then prescription volume and market share growth. Your sales reps' activity matters a ton - call frequency, samples given out, new prescriber acquisition. Conversion rates are honestly where you'll see the biggest insights into what's actually working. Pipeline health is key too: time-to-first-prescription and how well you're retaining prescribers. Track competitive wins against other drugs. Oh, and set alerts for territories dropping more than 15% so you can jump in fast with help or pivot your approach.
Your dashboard metrics get hit by all sorts of outside stuff - seasonal illness patterns, competitor launches, regulatory changes. Flu season? Your respiratory drug sales will probably spike. New generic hits the market and boom, your brand numbers tank. It's crazy how fast things change, honestly. Look for weird spikes or dips that don't match your usual sales cycles or promos. Set up alerts for big variances so you can figure out if it's the market being the market or if there's something internal you need to fix.
Honestly, I'd go with Power BI if you're already using Microsoft stuff - it just works better with pharma data sources. For visualization, Tableau's solid too, or D3.js if you want to get fancy with custom builds. Your backend's gonna need good ETL processes pulling from CRM and ERP systems. Python scripts work great for that, or Alteryx if you have budget. AWS or Azure are basically required now for real-time updates and scaling. Oh, and make sure it works on mobile since your sales reps are never at their desks anyway! Start simple with Power BI though - way less headache.
Look at your performance metrics first - if some reps are consistently tanking in certain product lines, that's your answer right there. The dashboard shows conversion rates, call frequency, all that stuff. I swear, numbers don't lie about who needs help where. Watch for patterns like crappy adoption rates on new products or when people bomb with specific customer types. Oh, and definitely compare before/after metrics to see if training actually worked. My advice? Set up regular check-ins so you're catching this stuff early instead of scrambling later.
Ugh, pharma is brutal - the regulatory stuff alone will make your head spin. FDA compliance for every single metric, adverse event tracking, the whole nine yards. Sales cycles drag on forever too since you're waiting around for formulary approvals and those payer negotiations are a nightmare. Then there's the data mess - physician prescribing patterns, patient outcomes, all while keeping PHI locked down tight. Honestly feels like juggling three dashboards at once. I'd tackle compliance requirements first, then build out the business intel on top. Trust me, future you will thank you when audit season rolls around.
Just build the chat stuff right into your dashboard - we use Slack integration and it's honestly amazing. You can drop comments directly on specific data points and set up alerts that ping everyone when you hit targets or miss them. Create separate channels for each region or therapeutic area, then your dashboard automatically pushes updates there. The annotation features are pretty slick too - way better than screenshotting charts and texting them around. Real-time commenting keeps everyone on the same page about pipeline changes without constantly switching between apps. Makes quarterly planning meetings way less painful since we're all already caught up.
Set up automated rules that catch weird stuff - negative sales, crazy high volumes, that kind of thing. You need regular checks between all your systems (CRM, ERP, whatever you're using) and someone actually needs to own each data source. Can't tell you how many times I've seen good dashboards turn to garbage because no one's paying attention to what goes in. Build audit trails so you can track numbers back to where they came from. Maybe add approval steps for manual entries too? Main thing is stopping bad data before it screws up your reports.
Honestly, dashboards are a game changer for seeing how your sales line up with marketing spend in real time. You'll spot which campaigns actually bring in quality leads and conversions - not just the flashy ones marketing loves to talk about. Set up alerts so you know the second a campaign drops in your territory. Then you can jump on that momentum right away. The timing piece is huge too. Match your outreach with peak campaign moments and you'll see which providers respond best to different messaging. Takes some setup but totally worth it once you get the flow down.
Patient data exposure is your biggest headache here - aggregated sales info can still get reverse-engineered to show prescribing patterns, which is a HIPAA disaster waiting to happen. Healthcare provider leaks are another major risk. You don't want to accidentally expose pricing strategies or market share stuff either (competitors love that intel). Access controls are non-negotiable, plus data masking for the sensitive bits. Honestly, I'd run a privacy impact assessment before going live with anything customer-facing. Regular audits help catch problems early too.
-
Unique and attractive product design.
-
Easily Understandable slides.
-
Content of slide is easy to understand and edit.