

 0 Comment
 Customer Reviews

Is resource allocation just planning or the secret behind peak performance? Resource allocation is the deliberate act of assigning resources (time, people, budget, equipment, etc.) to projects or activities. It means that every project has what it needs to complete the activity effectively. Resource allocation helps ensure that organizations are operating optimally, minimizing waste, and achieving objectives on time and within budget. It provides many advantages to help an organization carry out its objectives efficiently and effectively.
What happens when the right resources meet the right tasks? Check here our blog on Top 10 Resource Dashboard Templates with Samples and Examples
Resource allocation also helps to minimize delays and over-allocation or under-allocation of human and financial resources for a project. Allocating resources also assists groups with project planning. Moreover, resource allocation can help indicate important resource availability issues and aspects of strategic decisions such as gaps or surplus in resources.
Explore here Top 10 Resource Allocation Templates with Samples and Examples to ensure your business master this critical aspect.
In addition, resource allocation promotes transparency and accountability among team members when working together, which may lead to improved collaboration and group morale. Overall, effective and proper resource allocation assists any organization in completing projects on time, on a budget, and successfully. SlideTeam is your go-to-resource as we have curated expert-level, 100% editable, customizable, and content-ready presentations.
Check out our blog on Top 10 Resource Utilization Templates with Examples and Samples for complete understanding.
Let’s explore.
Template 1: Resource Level and Budget Allocation Dashboard PPT Template
This PPT Template monitors both project resources and budget efficiency. The dashboard is useful in displaying projected vs actual hours of resource consumption, allowing for monitoring of resource consumption against the original budget. It figures both members' tasks and the budget. Using this PPT Template, project managers can locate where key member contributions took place. It can also be used to analyze the budget so the project manager can identify the gaps, optimization of team performance can occur, while controlling costs. The template also provides real-time updates that are data-driven, assisting with decision-making and ensuring resources are aligned with the project goals. Download template now.

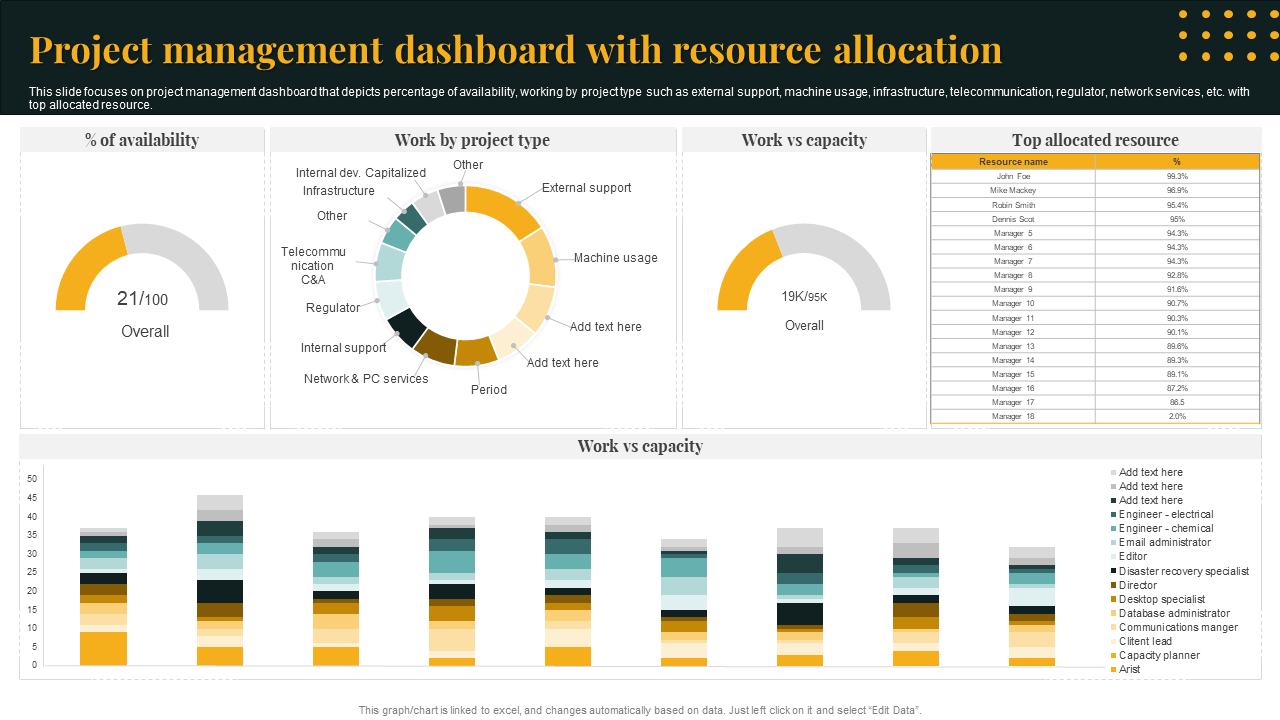
Template 2: Project Management Dashboard with Resource Allocation PPT Template
This template provides a robust visual landscape of team availability, assignment of projects, and capacity utilization. The dashboard provides managers insight into total resource availability, distribution of work across project types (support, infrastructure, telecom, etc.), and work vs. capacity comparison. The slide also breaks out work by most allocated team members, which can be useful for assessing work balance or whom to assign new work. The interactive charts and real-time data puts project leaders in the driver's seat.
Template 3: Resource Demand and Capacity Planning Dashboard PPT Template
This PPT provides an overview of project types to showcase aspects of resource allocation, availability, and workload including key insights into percentage of resource availability, realistic pending approvals, major overallocated resources, and work versus capacity. As resource planning and workforce optimization is all about strategy, this dashboard gives managers the necessary insights into how demand trends and actual performance responds over time. It also provides managers with information to make ongoing operational efficiency improvements, while planning ahead.

Template 4: Resource Allocation Dashboard for Efficient Performance Monitoring
This template provides an effective and concise view of resource consumption and invoicing and the review workflows that accompany those. This dashboard allows project managers to understand total and chargeable employees, track what bills are pending or closed, measure insights into operational efficiency (or inefficiency), and produce visual layouts that build fast decision-making and real-time insights into expenses, hours, and invoice percentages. In addition, the dashboard can show you when the project is getting off course, make it easier for project managers to track real-time budget consumption and gauge employee performance and hours. Download template now.

Template 5: Capacity Allocation Dashboard with Staff Demand
Using this slide, project managers allocate available workforce to projects or team members. The dashboard uses metrics to make decisions related to capacity forecasts, unstaffed demand, allocation audits, and user allocation percentages. The dashboard outlines hard allocated versus soft allocated demand along with remaining capacity so project managers can more balance workloads. This tool facilitates decisions that increase productivity and optimizes resources.

Template 6: Resource Utilization Tracking Resource Management Plan PowerPoint Template
This dashboard will allow project and operations managers to visualize efficiency with allocated versus actual hours, understand resource demand variability by project type, and monitor resource performance, which will identify under or over-utilized team members so the plan can be refined if necessary. With illustrative bar graphs and pie charts, team decision-makers can track the extent to which a workload is balanced, projects are following a roadmap, and how much time is being expended. By providing a real-time snapshot of where and how resources are being spent, the template will encourage teams to make informed decisions.

Template 7: Team Resource Demand and Capacity Management Dashboard
This slide is a visualization strategy for project managers to track capacity of individual team members. Monitoring utilized, over, and under-capacity workload hours provides an instant workload balancing opportunity. The dashboard includes details and metrics, including total team hours, team capacity hours remaining, team over-utilized listing, individual assignments, key individual metrics and overall performance measures, etc. The charts and tables allow for easy visualization to allow for informed decisions that can help mitigate burnout and support improved productivity and ensure projects stay on track and time. Download template now.

Template 8: Monthly Resource Demands Capacity Planner Dashboard PPT Slide
This template provides a simple and actionable way to see full resource capacity, demand, and utilization across projects, skills, and teams. This dashboard is geared for efficient workforce planning by making visible overutilized and underutilized resources, capturing surpluses and deficits in each capacity facet, and looking at costs associated with each. The slide graphically indicates issues that need to be looked into by visually showing red and green bars corresponding to projects that have too much workload or areas of concern where certain projects do not have the necessary skills available to support them.

Template 9: Resource Allocation Dashboard for Supporting Forecasting Activities PPT
This PPT is a great way to visualize monthly resource allocation. It shows allocation broken out across the key job types, KTLO, Infrastructure, Bugs, Tech Debt, and Features, as well as the overall effort (in Full-Time Equivalents (FTE)) by month. The bar graph shows how much resource (FTE) is assigned to each job type, for which month, throughout the year. In addition, the investment matrix indicates costs by category and month. For strategic planning and project managers, this template will ensure a balanced allocation is achieved, unlock optimal resource planning, and, as a result, will support accurate forecasting to produce the best possible outcomes for your organization.

Template 10: Infrastructure KPI Dashboard Showing Resource Allocation PowerPoint Topics
This PowerPoint is a complete representation to help you measure project performance, resource allocation and money allocation across infrastructure projects. This dashboard represents the delivery times of projects, days spent on each project, percentage of resource allocation and how much of your budget has been spent in a simple visual manner. This slide was created for, but not limited to, infrastructure managers and decision-makers looking at resource bottlenecks, financial goals and schedule of working on the project. The design contains timelines and charts to help teams manage KPIs and fit into the budget for an enhanced operational capacity and better strategic results.

THE POWER OF SMART RESOURCE ALLOCATION
Resource allocation is crucial for achieving efficiency and desired organizational objectives. Regardless of the context—business, health care, education, or project management, efficiently deploying resources such as time, capital, people, and materials, organizations can get the work done efficiently and on time. Effective resource allocation reduces waste, costs, and bottlenecks. Careful resource allocation allows organizations to prioritize important work, respond to shifting needs, and deal with mistakes. In addition, efficient resource allocation leads to improved morale since workload progress can be more evenly distributed and everyone has a clearer understanding of their corrected expectations. In projects, it is critical to minimize delays and make sure that each element of work has sufficient support and resources. Organizational health services can do better job of planning services and allocating resources to ensure healthy services for their population.
FAQs
1. What is a resource allocation dashboard?
A resource allocation dashboard gives organizations, teams and project managers a way to easily track, manage, and optimize the allocation of resources, including time, people, budget and equipment. This dashboard allows organizations to visualize their resources, allowing for real-time perspectives of resource usage, allocation, and performance over projects or departments, giving users, organizations, managers and teams, the ability to make better data-driven decisions and make proactive adjustments to achieve strategic organizational & departmental objectives and goals predictably.
2. Why is a resource allocation dashboard important for project management?
A resource allocation dashboard is essential for project management because it provides an up-to-date, complete view of the resource allocation status across tasks. It reduces the risk of over-allocation or under-utilization, it helps ensure project deadlines are adhered to, and it allows for evidence based decisions to be made. It allows for resources used to be optimized for productivity, lowers costs and gives staying power for project schedules and goals.
3. How does a resource allocation dashboard improve team productivity?
A resource allocation dashboard increases productivity in a team by providing management with a clear overview of workloads. This allows management to see the workload each person has and facilitate an even distribution of tasks. With this information, management can easily identify individuals who are over or under allocated. This allows them to take timely actions with regard to the workload.