


 0 Comment
 Customer Reviews

Ever feel like you're drowning in a sea of data? Bank statements that scroll endlessly, spreadsheets that stretch wider than your screen, and transaction lists that blur into a confusing mess? For businesses, banks, and even individuals, the sheer volume of financial activity can feel less like information and more like an overwhelming tide. How do you find the trends? Spot the red flags? Or simply understand where your money is truly going?
According to a 2024 survey by Gartner, financial mistakes are more common than you'd think. 18% of accountants say they make errors every single day. Nearly 6 out of 10 say they slip up at least once a month. This can lead to financial losses and make clients lose faith in your business.
Here’s where transaction dashboards can help you!
Transaction dashboards are simple, visual tools that help you keep track of all your business transactions in one place. They present essential KPIs that help you keep track of your financial accounts. With these dashboards, you can reduce errors and spot useful trends or fraudulent activities. These dashboards allow you to make data-backed decisions and control your cash flow!
To help you out, we have professionally created Transactions Dashboard Templates. These ready-to-use templates will help you save time and make complex financial information easy to understand. As these presentation slides are fully editable, you can easily use them for financial reporting and transaction management.
Check out some of our best Transactions Dashboard Templates below:
Template 1: Transaction Data Overview Payment Dashboard Template
With this PPT Template you can quickly see and manage all your money moving in and out, whether you're paying bills or transferring funds. The layout is divided into different sections. The first line graph shows how much money you're transferring each day. The center displays a donut chart, which tells you what percentage of your funds went to payments, were moved, and how much remains. The card information shows your current balance. The bottom part of the framework displays detailed transaction history and also displays a budget, which helps you track spending from savings. Get it now!

Template 2: Financial Services KPI Dashboard For Analyzing Transactions Template
What if you had a report card to compare different bank branches all in one place? This PPT Preset presents a KPI dashboard that helps management teams and customers understand how well each branch is making money, spending, and earning profit. This layout presents complex financial information easily with the help of data visualization. It will help bank staff and managers make faster and more intelligent decisions about where to focus their efforts. The framework will help you track performance overall and find which branches are doing well and which ones need more attention. Get it now!
Click here and check out more banking dashboards!

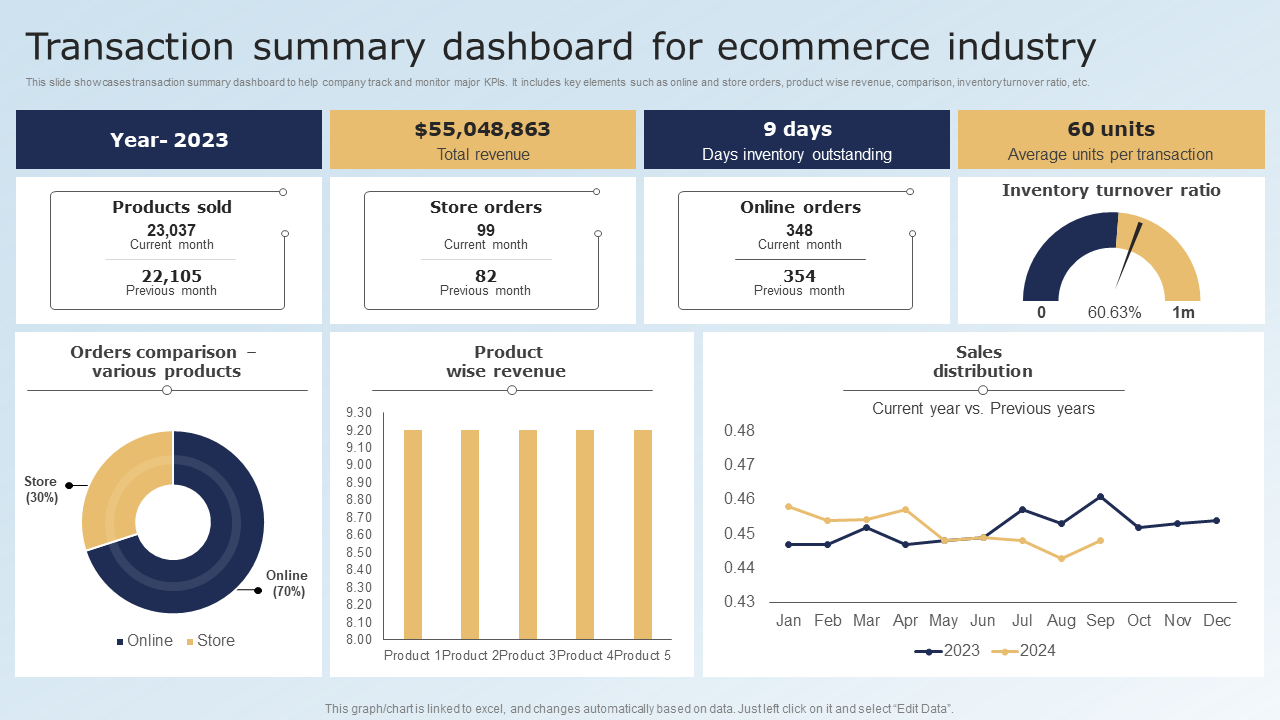
Template 3: Transaction Summary Dashboard For the E-commerce Industry Template
This PPT Framework will help you with financial reporting and transaction management. It is like a command center for an online store. The layout of this e-commerce dashboard will help you get a snapshot of your business's overall financial and operational health quickly. You can easily see if sales are going up or down, whether more people are buying online or in-store, and how quickly products are selling. The framework will help you decide better what to sell, where to focus marketing, and how to manage your stocks. Get it now!
Receipts track what's paid, invoices track what's due—explore both templates to build a complete financial dashboard that leaves no detail behind.
Template 4: Financial Transaction Tracking Dashboard For Banks
Banks are essential institutions handling money, and it is necessary to monitor transaction history closely. This PPT Template is designed to help banks monitor all the money movements. The layout presents transaction KPIs for monitoring credit, check, ATM, and debit cards. It also displays a decline rate, which tells how many transactions failed to go through for various reasons. A high decline rate is a red flag, so you can easily spot any errors that need correction. Other visual graphs display transaction volumes, which will help you understand which payment method is most used by customers. Get it now!

Template 5: Dashboard to Monitor Bank Transactions
This PPT Design can be used as a bank's central command center to check on everything related to transactions. The “every minute charts” and real-time analytics KPIs help banks to track transactions while they happen. This will allow for prompt identification of any issues and resolution on time. The layout helps to visualise transaction volumes and decline rates, which will help banks improve their operational efficiency. Additionally, monitoring decline rates by transaction type helps quickly identify suspicious patterns. Get it now!

Template 6: Fintech Banking Dashboard to Track Transactions Template
This PPT Framework will help you show your clients how you value them and their money, along with showing them why your bank can be trusted. It is designed to give a complete picture of a client's money and performance. Instead of logging into multiple accounts or digging through statements, all the essential financial information is neatly organized. The visual charts make it easy to show your audience financial data without confusing them. The dashboard will make it easy to manage money, gain clients’ trust, and invest smartly. Get it now!

Template 7: Dashboard for Transaction Summary by Purchase Currency
Buying and selling foreign currency is a hectic task. This PPT Framework presents a detailed digital ledger that will help you explain foreign exchange activities and ensure all transactions balance out. The layout helps boost business intelligence by displaying various performance metrics essential for balancing the books. These include net settlement value, reconciliation, and fees. It also consists of a transaction summary table, which presents a core detailed report, breaking down foreign currency transactions by the actual currency involved. This highlights which currencies are most popular, how many transactions succeed versus fail, and the true net revenue generated from each. Grab now!

Template 8: Dashboard Overview for Detecting Fraud Transactions
How do you safeguard your transactions from fraudulent activities? This PPT Template presents a financial dashboard to help organizations handle transactions to identify, analyze, and combat scams. It works as an early warning system and analytical hub. The layout is divided into different sections, including fraudulent transaction distribution, fraudulent transaction date, and fraudulent transactions country and merchant-wise. This framework will help you with rapid fraud detection and situational awareness based on geographical and categorical insights. This will help you develop targeted prevention strategies. Get it now!

Template 9: E-Commerce Financial Fraud Transactions Dashboard Template
This PPT Preset is designed for online businesses or e-commerce companies to monitor and analyze fraudulent activities related to their financial transactions. It's like a security camera for online payments, helping companies to spot and understand scams. This increases operational efficiency and helps in reducing financial losses by quickly acting against scams. Additionally, the quicker your business’s response towards the fraud the more your customers will trust your business. You can also keep updating your prevention strategies based on all the data. Get it now!

Template 10: Online Banking Dashboard to Track Transactions E E-Banking Management And Services
Want to get sales analytics and revenue tracking at the same time? This PPT Slide presents an instant financial overview, including a profit and loss overview and transaction trends for your business. The layout starts by displaying account balances, which show your funds across different accounts. Next, the expense activity graph helps companies visualize spending patterns over time. It also displays recent transactions along with income and expenses. This allows us to understand the overall cash flow trend. Get it now!

Template 11: Transaction Tracking Dashboard for AML Compliance
Want to combat Anti-Money Laundering (AML)? This PPT Preset is designed to monitor transactions for any suspicious patterns. These suspicious activities can indicate illegal financial activities like money laundering or terrorist financing. The framework can be used as a sophisticated alarm system for economic crime. The layout presents important KPIs that give a quick summary of transaction volume and potential risks, which assists in proactive risk management. Additionally, it is designed to meet stringent AML regulations set by authorities, helping banks avoid massive fines and reputational damage. Download now!
[product_image id=1211054]
Template 12: Procurement Transaction Summary Dashboard for Organization
Is your company involved in manufacturing or has it significant purchasing needs? Then this PPT Template will help you get a clear overview of how much money you spend on buying goods and services (procurement), along with noting any savings through discounts. It also displays how businesses’ spending patterns have evolved over time and across different suppliers and regions. For instance, the total invoice and discount percentage chart lets you compare spending trends directly with saving trends, which will indicate if you need to negotiate better. It will also help you with budgeting and forecasting along with improved vendor management. Get it now!
[product_image id=728718]
Bring Clarity to the Financial Chaos!
Tracking transactions isn’t exactly anyone’s idea of fun. The numbers pile up, the spreadsheets get longer, and before you know it, you're squinting at rows of data wondering, “Wait… where did that money go?”
Transaction dashboard templates help turn complex financial reports into easy-to-understand data with the assistance of visual tools like graphs. These KPI dashboards help in real-time analytics, so you can understand where your money is going and make maximum ROI. Download today and manage your hard earned money better!
Want to check out more finance related dashboards? Click here!
FAQs
1. What types of transactions are tracked on the dashboard?
You can track your business’s complete financial health with transaction dashboards, including (but not limited to):
- Sales
- Payments (like credit/debit card, bank transfers)
- Refunds and returns
- Failed or declined transactions
- Online and in-store purchases
2. How is transaction volume displayed over time?
Transaction volume can be displayed by various ways, such as:
- Line graphs showing daily, weekly, or monthly activity
- Bar charts comparing different time periods
- Trend lines to highlight increases or drops over time
3. What metrics indicate financial performance trends?
- KPIs which indicate financial performances trends include:
- Total revenue and expenses
- Net profit or loss
- Conversion rates (how many visits turn into purchases)
- Average transaction value
- Growth rate in sales or transactions over time