

Box plot median quartile and interquartile range





Try Before you Buy Download Free Sample Product
 Impress Your
Audience
 100%
Editable
 Save Hours
of Time


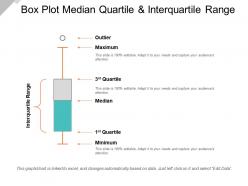
Introducing Box Plot Median Quartile And Interquartile Range slideshow. Take the advantage of this PPT layout to display a number summary of a set of data. Educational institutions can utilize this effective template to explain the various concepts of statistics and mathematics. You can utilize this box plot diagram for numerous purposes such as to find interquartile range, show the shape of the distribution, its central value and its variability. This bivariate boxplot PPT layout helps in a quick graphical examination of one or more data sets. Display distributions through their quartiles by incorporating this boxplot chart. You can showcase the elements of a box plot like minimum, maximum, median, first quartile and third quartile. This visually appealing graph template gives a good indication of how the values in the data are spread out. With this dot box plot PPT template you can represent the percentage values and make a meaningful presentation. Thus, create a meaningful presentation by downloading this whiskers plot PowerPoint Presentation.
People who downloaded this PowerPoint presentation also viewed the following :
Box plot median quartile and interquartile range with all 5 slides:
Display an exceptional degree of awareness with our Box Plot Median Quartile And Interquartile Range. You will appear confident and assured.
FAQs for Box plot median quartile
So basically, box plots show five main things about your data - the minimum, Q1, median, Q3, and maximum. The actual box part goes from Q1 to Q3, which is where half your data sits. There's a line inside showing the median. Then you've got whiskers stretching out to the min/max, though outliers can make those look kinda funky. If the median line isn't centered in the box, your data's probably skewed one way or another. They're honestly pretty handy when you need to compare different datasets quickly - way easier than staring at a bunch of numbers.
Oh, box plots make outliers super easy to spot! Look for dots hanging out past the "whiskers" - those lines sticking out from the main box. The whiskers go about 1.5 times the IQR from each edge, and anything beyond that shows up as individual points. Way better than doing z-score math in your head, honestly. I always forget the formula for that anyway. Just scan for those random dots floating by themselves. When you find them, figure out if they're mistakes in your data or actual weird values worth paying attention to.
When you're comparing multiple groups, box plots are way better than histograms. You can line up like 5-10 of them side by side without everything looking messy - histograms just get cluttered. They're perfect for spotting outliers too. Your audience can instantly see the median, quartiles, all that summary stuff without getting lost in the weeds. Honestly, I used to default to histograms for everything until I realized how much cleaner comparisons look with box plots. Next time you're showing team performance or regional data, definitely go with these. Way cleaner presentation.
Yeah, so with small sample sizes your box plots get pretty messy - the quartiles jump around and don't really settle into reliable positions. With bigger samples they smooth out way better. The whisker calculations go kinda haywire too when you've only got like 20 points - suddenly everything looks like an outlier when it's probably fine. Honestly, anything under 30 observations and I'd just plot the actual data points on top of the box plot. That way people can see what's actually happening instead of trusting some weird-looking box that might be misleading them.
So basically, when your box plot looks wonky - like the median line is shoved to one side or there's this crazy long whisker - that's telling you your data is skewed. Most statistical tests hate that because they want normal distribution. I learned this the hard way in grad school, honestly. You've got two options: transform your data with something like a log transformation, or just use non-parametric tests instead. Those don't care about normality. Just don't ignore it and run regular tests anyway - you'll get garbage results.
Just throw all your box plots on the same chart - that's honestly the easiest way to compare them. Your datasets each get their own box plot, so you can see right away which groups have higher medians or more spread. Make sure they're all on the same scale though, otherwise you're comparing apples to oranges. You'll spot the weird outliers super fast this way. Most software does this automatically if you group your data by category first. I always forget how useful this is until I actually do it - then boom, all the patterns just jump out at you.
So box plots basically show you five numbers from your dataset: the minimum, maximum, median, and two quartiles (Q1 at 25% and Q3 at 75%). The actual box shows the middle 50% of your data, then whiskers stretch out to the extremes. Honestly, they're one of my favorite ways to quickly see if data's skewed or has weird outliers. You can spot the range right away too. I mean, you could calculate all this stuff separately, but why bother when you can just visualize everything at once? Super useful for comparing different groups side by side.
So IQR basically shows where the middle 50% of your data sits - it's way better than range or standard deviation because outliers can't mess with it. You're looking at everything between the 25th and 75th percentiles, which is honestly the most useful part anyway. Narrow IQR? Your data's clustered tight around the median. Wide IQR means things are more spread out. I always just look at box plots and see if the actual box part looks skinny or thick - gives you the answer right away without doing math.
Oh man, the biggest thing people get wrong is thinking the box shows where most data actually lives - totally false! It's just quartiles. You could have everything bunched at the edges with nothing in the middle. Also, don't expect that median line to sit perfectly centered - skewed data shoves it around. And those outliers past the whiskers? They might be completely normal for what you're measuring. I learned this the hard way with some gnarly survey data last year. Honestly, always peek at your raw distribution too or you'll miss half the story.
Dude, color coding totally saves you in box plots. Your audience can instantly tell which box is which dataset without hunting for labels - like blue for Team A, red for Team B. Way cleaner than squinting at tiny text. Plus patterns and outliers jump out so much better than boring black and white charts. One thing though - don't go crazy with random rainbow colors (I learned this the hard way). Pick colors that actually make sense to people and throw in a legend. Trust me, your presentations will look way more professional.
Honestly, box plots are pretty limited when you want to see what your data actually looks like - they'll totally miss multiple peaks or weird patterns. Small datasets are another problem since quartiles don't mean much with like 15 data points. And forget using them for categorical stuff or when you need exact values. They're kind of a snooze fest in presentations too, not gonna lie. Histograms work way better for seeing distribution shapes. Scatter plots are your friend for smaller datasets, and bar charts obviously win for categories.
So the median line basically shows you where the middle value sits in your data. When it's right between Q1 and Q3, your data's pretty balanced. But here's the thing - most real data isn't that neat. If the median's closer to Q1, you've got right-skewed data with a long tail stretching toward higher values. Closer to Q3? That's left-skewed. Honestly, I always check the median position first when I'm looking at box plots - it's like a quick cheat code for spotting if your data leans one direction or the other.
For box plots? Python with seaborn is my go-to - super clean looking results. R works great too if you're already using it. Excel can actually make them now (I know, weird right?). Tableau's solid for the point-and-click crowd. Honestly though, I'd just use whatever you already know since they all do the basic stuff fine. Google Sheets even works if you're in a pinch. You can always switch to something fancier later if you need more control over the styling.
Nah, you can't make box plots with categorical data since there's no way to calculate medians or quartiles from categories. But here's the thing - you can totally use categories to group your numerical data! Like if you've got sales numbers and want to compare different regions, just make separate box plots for each region side by side. That's honestly where box plots really shine. Oh, and if your data is purely categorical (no numbers involved), stick with bar charts instead. They'll actually make sense for what you're trying to show.
Hey! For box plots, use the same colors across groups and make those whiskers pop. Order categories alphabetically or by median - whatever makes sense. Sample sizes under each box help a ton. I swear, half the ones I see have fonts you need a magnifying glass for! Keep box widths consistent when comparing groups, and throw in some white space so it doesn't look cramped. Oh, and definitely explain what your quartiles mean - people shouldn't have to guess what they're looking at.
-
It saves your time and decrease your efforts in half.
-
Topic best represented with attractive design.