


Business forecasting ppt example file




Try Before you Buy Download Free Sample Product
 Impress Your
 Audience
 100%
100% Editable
 Save Hours
 of Time


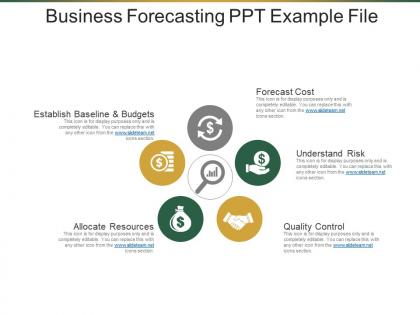
The Business Forecasting PPT Example File helps an organization in estimating the budget, growth as well as the outcome of the events. Through this business forecast plan PPT slide, a corporation can form marketing plans to get the desired results. The business forecast process template for PowerPoint presentation describes the process of making a future prediction for the business based on trend analysis. The forecasting business plan PPT slide design is an essential management PowerPoint presentation for executive meeting for explaining the future financial growth through new product development to the clients. Further, the business planning presentation slide is ideal for an entrepreneur who can present his innovative startup to the investors. When you include the business forecast planning example PowerPoint slide in the project proposal presentation, your chances of receiving financial investment increases. You can create a comprehensive business forecast report by using the business forecasting report presentation template which is appealing to the audience and they understand the business forecasting concept easily.
People who downloaded this PowerPoint presentation also viewed the following :
Business forecasting ppt example file with all 5 slides:
Folks experience immense bliss due to our Business Forecasting Ppt Example File. Hearts will burst with joy.

FAQs for Business forecasting
So there are basically three ways to forecast stuff. Qualitative uses expert opinions and surveys - great for startups or when you don't have much data yet. Quantitative relies on historical data and statistical models, which works well if you've got solid past trends. Then there's causal modeling that looks at how outside factors mess with your business. Most companies I've seen just mix all three methods anyway. My advice? Figure out what data you actually have first, then go from there. Oh, and don't stress too much about picking the "perfect" method - honestly, something's better than nothing.
Okay so first thing - you've gotta clean up that messy historical data. Remove the weird outliers and seasonal stuff that throws everything off. Honestly, most people skip this step and wonder why their forecasts suck later. Try to use 2-3 years of data if you can find it. Break everything down by product lines or customer segments - whatever makes sense for your business. Plot it visually first though. You'd be amazed what patterns just pop out when you actually look at the charts. Then test your model on recent data to see if it's actually working before you commit to using it.
Honestly, tech is a game-changer for forecasting because it handles all the tedious number-crunching you'd otherwise spend hours on. Machine learning gets pretty impressive - it actually learns from your old data and keeps getting better at predictions. You can run different scenarios at the same time instead of doing everything step by step. The pattern recognition stuff is wild too; it catches things you'd totally miss looking at spreadsheets. Cloud tools are great since everyone can work on the same forecast instead of emailing files back and forth (which always turns into a mess). I'd start with one tool that connects to whatever data you're already using. Don't go crazy with features right away.
Yeah, economic trends will totally mess with your forecasts if you're not watching them. Your historical data can't predict when recession fears tank luxury sales or inflation spikes costs. I learned this the hard way honestly - past trends only tell you so much. You've got to bake economic indicators into your models as leading signals. When big shifts happen, adjust your assumptions on the fly. Don't just rely on extrapolating old patterns. Monitor the economic stuff that actually matters for your industry and keep your models flexible enough to handle surprises.
Honestly, most people lean way too hard on old data and ignore how markets actually shift. Your biggest enemy is bias - everyone loves painting these super rosy pictures that'll never happen. Don't use outdated sources either, and actually pay attention to what competitors are doing. Economic changes matter more than you think. Here's the thing though - barely anyone tracks if their forecasts were right, which is kind of insane? You're missing easy wins to get better. Start small, question your assumptions constantly, and yeah... always throw in some doom scenarios just in case.
Honestly, I'd start with your data models as the base - they're solid but not the whole story. Then bring in the human stuff: what are your sales people actually hearing? Customer complaints? Market chatter? That intel often spots things before the numbers do. My old team used to swear by this approach. Document whatever adjustments you make though, because tracking accuracy helps you get better at mixing both approaches. Sometimes the gut feelings are spot on, other times... not so much. But when you blend them systematically, you'll catch way more than either method alone.
So there's four metrics you should definitely track. MAPE is probably your best bet since it's just a percentage - super easy to explain to your boss. MAD shows the actual error amounts, which is useful too. Don't sleep on Forecast Bias though, that'll tell you if you're always predicting too high or low. Oh and variance between forecast vs actual - I can't stress this enough. Seriously, I've watched entire teams completely miss obvious patterns because they weren't checking this regularly. Just build a quick dashboard that auto-calculates everything so you can catch problems early.
Honestly, seasonal stuff can completely mess up your forecasts if you're not careful about it. Retail goes crazy during holidays, hotels boom in summer/winter, agriculture follows harvest schedules - miss these patterns and you're screwed. What makes it harder is some industries have like multiple seasonal layers happening at once (ice cream gets hit by both weather AND holiday effects, which is annoying). You'll need at least 2-3 years of data to spot your specific patterns before building models. Seasonal decomposition techniques help separate the actual trend from all the cyclical noise.
Honestly, just start with Excel if you're doing basic stuff - those pivot tables are way more powerful than people think. Python with pandas is incredible but yeah, the learning curve sucks if you're not already into coding. Tableau and Power BI are solid for making dashboards that actually look decent. There's also dedicated tools like Forecast Pro or SAP Analytics Cloud, though I haven't used SAP much personally. My take? Don't overthink it at first. Use whatever you know already, then upgrade when things get messier and you need fancier features.
Honestly, being small is your secret weapon here. Big companies are stuck in endless meetings while you can pivot the second you notice something's off. Just grab Excel or some cheap forecasting tool - nothing fancy needed. Track maybe 3-5 things that really matter to your business first. Customer buying patterns, when things get busy or slow, cash flow stuff. Don't overthink it though. I've seen people get paralyzed trying to build the "perfect" system from day one. Start simple, stay consistent, then build on what's working. You'll be adjusting course way faster than your bigger competitors can even schedule a planning meeting.
So scenario planning is like having multiple game plans ready when your forecasts inevitably go wrong. You map out different "what if" situations - best case, worst case, the realistic middle ground. That way when stuff hits the fan (and it will), you're not scrambling to figure out what to do next. Pick 3-4 big variables that could mess with your business. Build scenarios around those. It sounds like overkill but honestly saves your butt later. Forces you to question your assumptions too, which we all need more of.
Honestly, you've gotta bake scenario planning right into your forecasting from day one. I do best case, worst case, and realistic scenarios now - learned that lesson the brutal way in 2020! Update quarterly instead of yearly because things change fast. Build some cushion into your cash flow planning too. Oh, and set up trigger points that force you to revisit forecasts when certain numbers get hit. Track leading indicators in your space so you'll see problems coming before they wreck your numbers. Sounds like extra work but it's saved my butt multiple times.
Look, consent's huge here - get proper permission before using people's data, especially personal stuff. Be upfront about what you're collecting and why (seriously, customers lose their minds when they feel tricked). Only grab data you actually need for forecasting, not every piece you can find. Oh, and watch out for biased data sources that might screw over certain groups unfairly. Document everything you're doing and audit it regularly. Trust me, staying compliant now beats dealing with legal headaches later.
Honestly, customer behavior analysis is a game-changer for forecasting. You get the "why" behind sales instead of just looking at numbers. Like, when you track what actually makes people buy - seasonal stuff, how price-sensitive they are, buying patterns - your predictions become so much better. Way better than just using old sales data. You'll spot trends before they hit and can adjust inventory accordingly. The trick is finding the right behavioral metrics to track consistently, then actually using that info in your forecasting models. It's basically like having insider knowledge on your own customers.
Dude, you'll get way better data when everyone actually talks to each other. Sales knows what's in the pipeline, marketing has campaign timing down, operations understands capacity limits. Put all that together and your forecasts won't suck. Customer service is honestly where the gold is - they hear everything customers really think about before anyone else does. Finance can warn you about budget shifts coming down the line. Set up monthly meetings where departments share what they're seeing ahead, not just boring backwards reports. Trust me, those blind spots disappear fast when you're not forecasting in a vacuum.
-
Great quality product.
-
Awesomely designed templates, Easy to understand.