


Company Stock Analysis And Equity Research Report Powerpoint Presentation Slides


Try Before you Buy Download Free Sample Product
 Impress Your
 Audience
Editable
of Time


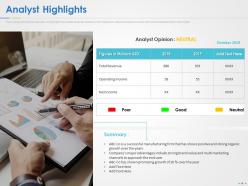
A document prepared by research analyst that focuses on the performance of a particular stock or any sector or Country. An equity research report helps the investor to take an informed decision while making any particular investment. This presentation is helpful for equity research analyst and investment bankers with an objective to analyze the target companys financial performance, ratios and their financial model and help the investor take a buy or sell decision. In the beginning this presentation provides an overview of the equity research report and the analyst overview for the same. The analyst highlights provide an overview of the analyst opinion and a brief summary of the report. After understanding the summary of the report, and overview of the industry Is provided that studies the competitive environment and the key Industry trends. Once the industry scenario is understood, key highlights of the target company are identified. These highlight include the overview of the company, the income statement, balance sheet, vertical and horizontal analysis, shareholding pattern of the organization, its SWOT analysis and historical share price performance. After getting the general highlight of the organization, the financial ratios are then studied. These ratios can be liquidity ratio, asset management ratio, leverage ratio, profitability and valuation ratio. After understanding the key ratios of the organization, valuation analysis is done. Multiple valuation methods such as discounted cash flow, Relative value approach, and precedents analysis is done After analyzing the organization key risk factors are analyzed and ratings are provided to the same. In the end an overview of our organization is provided that includes the about the origination, the equity team structure and equity team members. To end the equity research report final review and rating are provided that gives an overall analyst rating.
People who downloaded this PowerPoint presentation also viewed the following :
Content of this Powerpoint Presentation
Slide 1: This slide introduces Company Stock Analysis and Equity Research Report. State your Company name and begin.
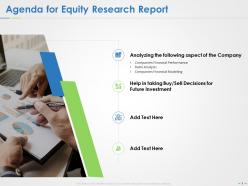
Slide 2: This slide displays Agenda for Equity Research Report
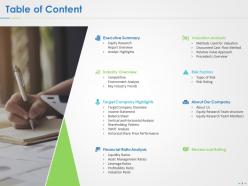
Slide 3: This slide displays Table of Content.
Slide 4: This slide shows Executive Summary of the company.
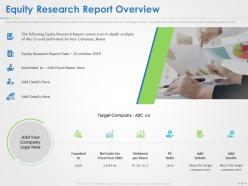
Slide 5: This slide provides and overview of the equity research report and displays some key stats about the target company . The slide also provides a brief Introduction about the equity research report.
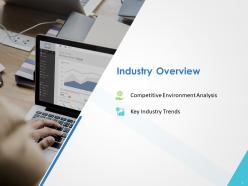
Slide 6: This following slide is to highlight the process of equity research which starts from Industry analysis and ends with recommendations from the analyst.
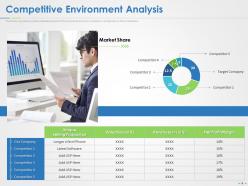
Slide 7: This slide shows Competitive Environment Analysis.
Slide 8: The following slide provides a detailed analysis of the market share of our company in comparison to the competition.
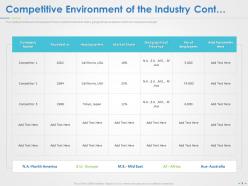
Slide 9: This slide provides a brief analysis of the competitors Market share, geographical presence and their employee strength.
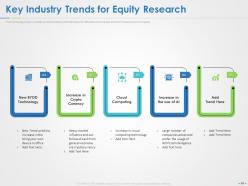
Slide 10: This slide to enlists various Industry trends that will influence the market and will influence the company.
Slide 11: This slide depicts Target Company Overview
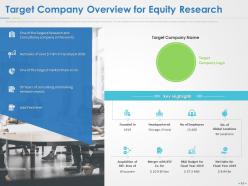
Slide 12: This slide is to provide an overview of the company on which the equity research report is being made. This slide highlights the year in which the company was founded in, number of employees it has, multiple global locations etc .
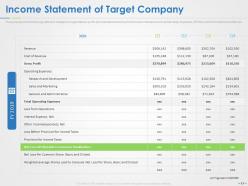
Slide 13: The purpose of this slide is to display the organizations profit and loss statements Key Performance Indicators such as Net Sales, Expenses , EBITDA and Profit before and after tax.
Slide 14: The purpose of the following slide is to display the key performance indicators of the balance sheet for four quarters of FY 2019. These KPIs can be Current assets, Current Liability , Total Assets and Total Liabilities.
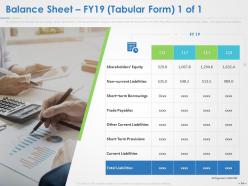
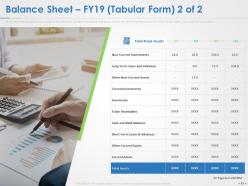
Slide 15: This slide is to display a tabular representation of the key performance indicators of the balance sheet for four quarters of FY 2019. These KPIs can be Current assets, Current Liability , Total Assets and Total Liabilities.
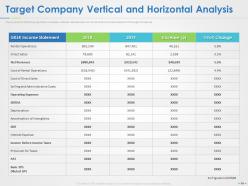
Slide 16: This slide display a tabular representation of vertical and horizontal analysis of the target companies.
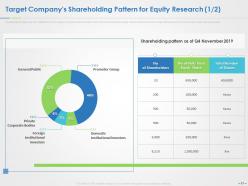
Slide 17: The following slide displays the share holding pattern of the company, the graph provides percentage of shares that are held by promotor groups, domestic institutional investors, foreign Institutional investors, Private Corporate Bodies and General public.
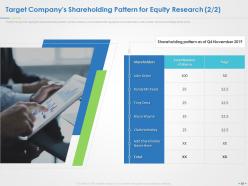
Slide 18: This slide highlights the shareholding pattern of the company, the provided table highlights the shareholders, total number of shares and %age of the same .
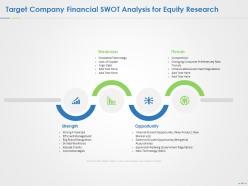
Slide 19: This slide shows Target Company Financial SWOT Analysis for Equity Research
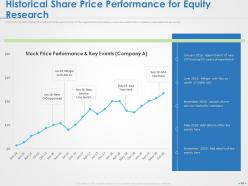
Slide 20: This slide displays the historical share performance of the organization and displays various key events that increased or decreased the sock price.
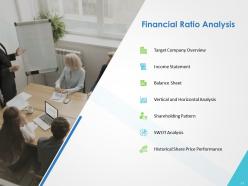
Slide 21: This slide displays Financial Ratio Analysis.
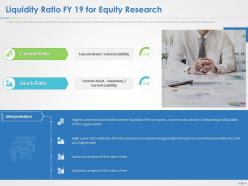
Slide 22: The following slide displays the analysis of the companies liquidity ratio of the financial year 19 as its analysis the current ratio , quick ratio and the net working capital of the organization.
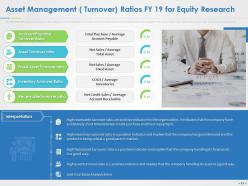
Slide 23: This slide displays the analysis of the company's asset management or turnover ratio of the financial year 19.
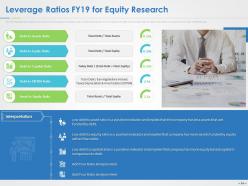
Slide 24: This slide displays the analysis of the company’s leverage ratio o of the financial year 19 as it analysis the debt to asset ratio, debt to equity ratio, debt to capital ratio and debt to EBITDA ratio.
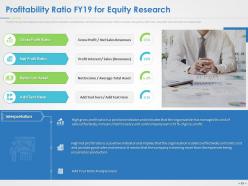
Slide 25: This slide displays the analysis of the company’s profitability ratio of the financial year 19 as it analysis the gross profit ratio, net profit ratio and return on asset ratio.
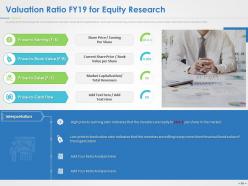
Slide 26: This slide is to analyze the valuation ratios of the organizations. Such as price to earning, price to book value rati, price to sales ratio and price to cash flow ratio.
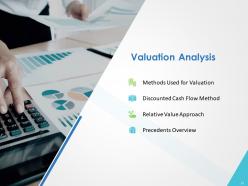
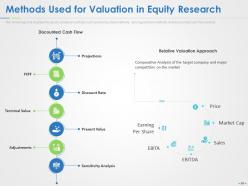
Slide 27: This slide depicts Methods Used for Valuation such as- Discounted Cash Flow Method, Relative Value Approach, Precedents Overview, Valuation Analysis.
Slide 28: This slide displays the equity valuation methods such as balance sheet methods, earning multiple methods and discounted cash flow method.
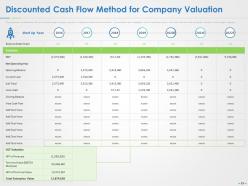
Slide 29: The purpose o the following slide is to provide target company valuation using discounted cash flow method , the provided table hoighlights the net operating losses , free cash flow and total enterprise valuation of the target company.
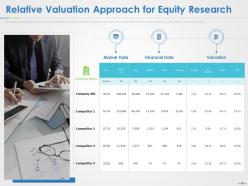
Slide 30: This slide displays the market data, financial data and valuation of multiple companies of the market. The provided table compares the price , market cap , Sales , EBITDA , earning and P/E ratio.
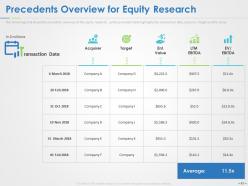
Slide 31: The following slide shows the precedent overview of the equity research, as the provided table highlights the transaction date, acquirer, Target and the value.
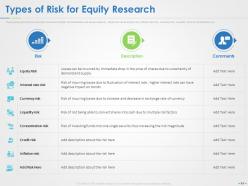
Slide 32: This slide shows Types of Risk.
Slide 33: The purpose of the following slide is to show multiple risk associated with equity research , these risk can be equity risk, interest rate risk , currency risk , Liquidity risk and concertation risk .
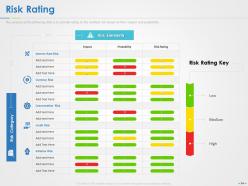
Slide 34: This slide is to provide rating to the multiple risk based on their impact and probability.
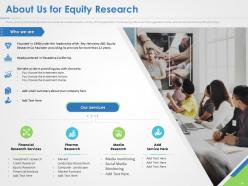
Slide 35: This is About Us slide to showcase Company specifications.
Slide 36: This slide provide the overall business summary of the organization. The following slide covers the organization history and the services that are offered by them .
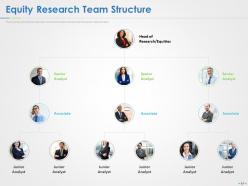
Slide 37: This slide shows the team structure of the equity research team.
Slide 38: This slide shows the review and ratings of the company provided by the analyst. The table highlights P/E ratio, valuation score, Net profit . The table also provides weightage average of the same.
Slide 39: This slide shows the equity research team of the organization as it highlights the key credentials of the team members, their names and their designation.
Slide 40: This slide presents Review and Rating.
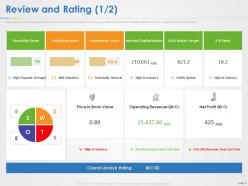
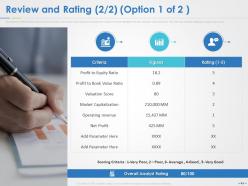
Slide 41: The purpose of the following slide is to show the review and ratings of the company provided by the analyst. The table highlights P/E ratio, valuation score, Net profit etc.
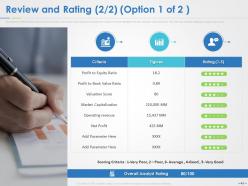
Slide 42: The purpose of the following slide is to show the review and ratings of the company provided by the analyst. The table highlights P/E ratio, valuation score, Net profit . The table also provides weightage average of the same.
Slide 43: The purpose of the following slide is to show the review and ratings of the company provided by the analyst. The table highlights P/E ratio, valuation score, Net profit . The table also provides weightage average of the same.
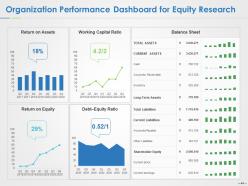
Slide 44: This slide shows Organization Performance Dashboard for Equity Research
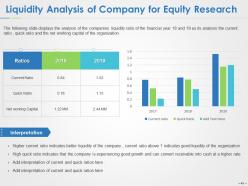
Slide 45: This slide displays the analysis of the companies liquidity ratio of the financial year 18 and 19 as its analysis the current ratio , quick ratio and the net working capital of the organization.
Slide 46: This is Icons Slide for Company Stock Analysis And Equity Research Report.
Slide 47: This slide is titled as Additional Slides for moving forward.
Slide 48: This is About us slide to showcase Company specifications.
Slide 49: This is Our Mission slide with Vision and Goal.
Slide 50: This is Financial slide. Showcase Finance related stuff here.
Slide 51: This slide depicts Our Target.
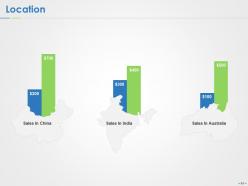
Slide 52: This slide shows Location
Slide 53: This slide displays Venn.
Slide 54: This slide is titled as Post It Notes for posting important notes.
Slide 55: This slide shows Timeline process.
Slide 56: This is Idea Generation slide to highlight important ideas, facts etc.
Slide 57: This is Thank You slide with Address, Email address and Contact number.
Company Stock Analysis And Equity Research Report Powerpoint Presentation Slides with all 57 slides:
Use our Company Stock Analysis And Equity Research Report Powerpoint Presentation Slides to effectively help you save your valuable time. They are readymade to fit into any presentation structure.


FAQs for Company Stock Analysis And Equity Research Report
Look for P/E ratio first - tells you if a stock's overpriced versus what they're actually earning. Revenue growth is huge too, shows the business is expanding and not just sitting there. Then check debt-to-equity because companies drowning in debt are risky as hell. ROE measures how well they turn shareholder money into profits, which is pretty crucial. Oh, and free cash flow - honestly that one might be the most important since cash flow problems kill businesses fast. Just compare all these to their competitors and industry averages so you're not flying blind.
Look, you can't just analyze a stock by itself - the whole economy affects how it performs. Interest rates change how much companies pay to borrow money and whether investors want stocks or safer bonds. When GDP grows, people spend more and companies make better profits. Inflation's tricky though - it hurts buying power but some companies deal with it way better than others. If your stock has international business, currency swings matter a ton. Employment numbers drive consumer demand too. Basically you need to figure out if the economic conditions are helping or hurting your company before you invest.
So technical analysis is basically looking at charts and price patterns to figure out where a stock might head next. You're studying things like volume, support/resistance levels, and moving averages. Honestly, some days it feels like fortune telling, but it does help with timing your buys and sells. I'd start simple - learn trend lines and basic moving averages first before getting into the fancy indicators. Oh, and don't rely on it alone - pair it with fundamental analysis too. The momentum indicators can be pretty solid for spotting entry points though.
So there's three main ones everyone uses. P/E ratio is just stock price divided by earnings per share - super easy but can get wonky if a company had some weird one-time thing that year. DCF is way more involved since you're projecting future cash flows and discounting them back, but honestly it's probably the most accurate method. Then price-to-book just compares what the market thinks it's worth vs what's actually on the books. Most people I know don't rely on just one though. I'd probably start with P/E to get a feel for things, then dig into DCF if you're really serious about it.
Dude, trends totally matter for stock picks. Like, renewable energy and AI are hot right now - even mediocre companies in those sectors are doing well. Meanwhile, if you're stuck with traditional retail while everyone's shopping online... yikes. Great companies in dying industries are still a bad bet, which honestly took me forever to learn. The whole sector gets lifted when there's positive momentum. I always check what's happening industry-wide before diving into specific company numbers. Short sentences work. It saves you from backing the wrong horse entirely.
Dude, earnings are absolutely wild for volatility. You're looking at 5-15% swings just on that one day. The whole market basically waits around until companies drop their numbers, then freaks out over any surprises. Here's the weird part though - even when companies beat expectations, stocks can still crash if their future outlook sucks. Honestly, if you hate risk just stay away from trading during earnings week. But if you're gonna do it anyway, definitely use smaller position sizes. Those moves hit way harder than regular trading days and can mess you up fast.
Yeah, insider trading can actually tell you a lot. Company executives know their business way better than we do, obviously. Multiple insiders buying? That's usually a good sign - they're putting their own cash down because they think the stock's undervalued or something big is coming. Selling gets weird though. Could just be them buying a house or whatever, not necessarily doom and gloom. Look for patterns instead of one-off trades. SEC filings have all this stuff, or check OpenInsider - honestly way easier to navigate. You'll spot moves before most people even notice.
When companies announce dividend changes, it's basically them telegraphing their financial situation. Increases usually mean management feels confident about future cash flow and wants to share the wealth. But cuts? That's your warning sign something's off - though occasionally they're just being smart about where to put their money. Watch the payout ratio too, because if they're paying out way more than they earn, that math doesn't work long-term. Stock prices often jump or tank right after these announcements since investors get emotional about their dividend checks. Oh, and mark those announcement dates - timing matters for your planning.
Honestly, it's all about how exposed companies are to international stuff. Defense and energy usually spike during conflicts - travel and luxury get crushed. Tech's weird though, sometimes it's the safe play, other times it gets destroyed if there's trade war drama (that whole China chip mess was brutal). Banks are super sensitive to currency swings and global chaos. When shit hits the fan, I always check where companies actually make their money geographically and how screwed their supply chains might be. Way more useful than just knowing if it's "tech" or whatever.
Hey! So the biggest thing is staying away from conflicts of interest - like don't analyze stocks you own without saying so upfront. Same goes if your company has deals with them. Obviously avoid insider info too, that's just asking for trouble with the SEC. Your research needs to be honest, not just hyping stuff up or tearing companies down for no reason. I mean, regulators can be pretty ruthless if they think you're being sketchy. Just ask yourself - could I explain what I'm doing and why without looking like an idiot? That usually keeps you on the right track.
Social media buzz is honestly where I'd start - Twitter and Reddit can move markets now, just look at the whole GameStop thing. Check analyst upgrades too, plus see if insiders are buying or dumping their own stock. That usually tells you something. Short interest data shows how many people are betting against a company. High numbers = lots of negativity. Put/call ratios give you the bigger picture of market mood, same with VIX levels when things get crazy. Don't rely on just one thing though - combine like 2-3 indicators and you'll get a better read on sentiment.
You gotta know who they're fighting against, right? I mean, some stocks look amazing until you realize their competitors are eating their lunch. Check if they're losing market share or if they've got something that actually protects them from rivals. Pricing power is huge too - can they raise prices without customers bailing? Compare their growth and profit margins to the competition. That's where you'll see if they're really winning or just good at marketing themselves. I've watched too many "sure thing" companies get demolished because nobody bothered looking at the competitive picture first.
Yeah, analyst ratings do move markets for sure. Goldman says "buy" and boom - stock jumps that day because people trust their research. But here's the thing - I've seen analysts be completely wrong about stuff I know well in my industry. The ratings mess with your head too, like seeing five "strong buys" makes you think differently even when you're trying to stay objective. I'd treat them as just one piece of info, not the final word. They're smart people but they're not psychic, you know?
Honestly, just start with the free stuff first - Yahoo Finance and Morningstar are solid for getting your feet wet. SEC filings on EDGAR if you want the real nitty-gritty data. TradingView's charts are pretty sweet for technical analysis. Bloomberg Terminal is like the holy grail but unless your work pays for it, forget about it (we're talking serious money). Oh, and check out company investor relations pages - they actually present their numbers way cleaner than most third-party sites. Finviz is great for screening stocks by whatever metrics you care about. Build your process with the free tools first, then you'll know what paid features are actually worth it.
Look, historical trends are useful for spotting patterns - like how your stock usually behaves during earnings or market crashes. You'll see support/resistance levels that tend to repeat. But don't treat them like some magic predictor. Market conditions change and past performance means basically nothing when everything shifts. I learned this the hard way in 2020 when "normal" patterns went completely out the window. Use the historical stuff as backup info, not your main decision maker. Always check what's actually happening now with fundamentals and market mood before you do anything.
-
Excellent Designs.
-
Great product with highly impressive and engaging designs.
-
Visually stunning presentation, love the content.
-
Use of different colors is good. It's simple and attractive.