


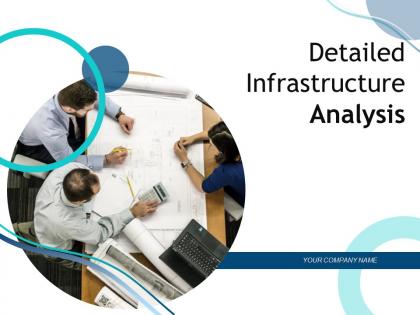
Detailed infrastructure analysis powerpoint presentation slides


Try Before you Buy Download Free Sample Product
 Impress Your
 Audience
Editable
of Time


Detailed Infrastructure Analysis PowerPoint Presentation Slides is a visually-stimulating virtual tool to represent organizational infrastructure insights. Our asset management PPT theme features griping graphical layouts so that your audience can easily comprehend sophisticated data. This infrastructure management PowerPoint slideshow helps you to elaborate on key funding areas and drivers for sustainable infrastructure management. Use this property management PPT template to illustrate the framework, process, and life cycle of asset management. By the means of our asset maintenance PowerPoint presentation, you can demonstrate inventory assessment and condition assessment for an individual facility. Take advantage of this asset analysis PPT deck to elucidate the types of deterioration models and risk assessment. Showcase infrastructure optimization, asset management decision journey, and value-driven decision-making methodology using our asset management PowerPoint theme. Portray performance and cost function dynamics related to infrastructure management, using the construction analysis PPT slideshow. So, download this asset management PPT slideshow to create a comprehensive presentation within moments.
People who downloaded this PowerPoint presentation also viewed the following :
Content of this Powerpoint Presentation
Slide 1: This slide introduces Detailed Infrastructure Analysis. State your Company name and begin.
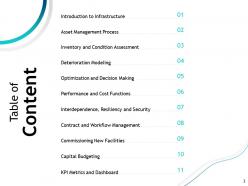
Slide 2: This slide displays Table of Content.
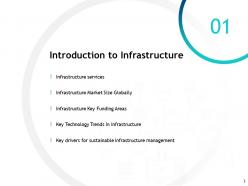
Slide 3: This slide shows Introduction to Infrastructure
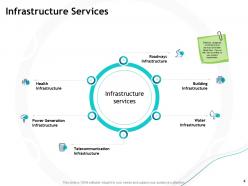
Slide 4: Different categories of Infrastructure services have been listed in this slide. You can edit this according to your project requirement.
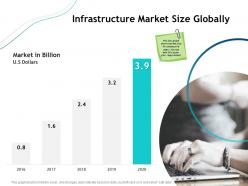
Slide 5: This bar graph shows market size for consecutive years. You can edit this as per your requirement.
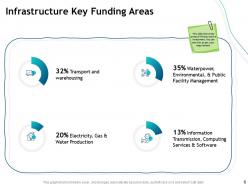
Slide 6: This slide shows key areas of infrastructure investment. You can edit this as per your requirement.
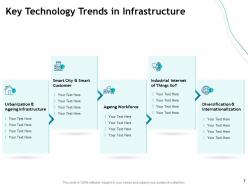
Slide 7: This slide presents Key Technology Trends in Infrastructure.
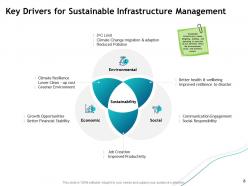
Slide 8: This slide shows Key Drivers for Sustainable Infrastructure Management Sustainable infrastructure means designing, building, and operating in ways that do not adversely effect the environmental, social, and economic system.
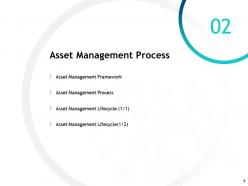
Slide 9: This slide depicts Asset Management Process.
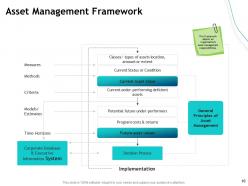
Slide 10: This framework depicts an organisation's asset management responsibilities.
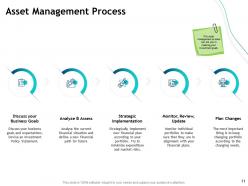
Slide 11: This slide shows Asset Management Process.
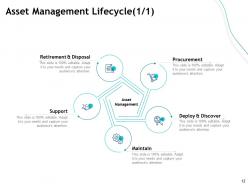
Slide 12: This slide presents Asset Management Lifecycle.
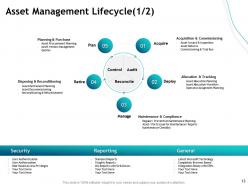
Slide 13: This slide shows Asset Management Lifecycle
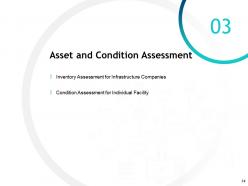
Slide 14: This slide depicts Asset and Condition Assessment.
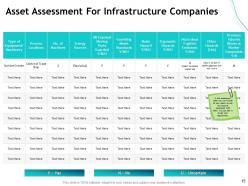
Slide 15: In this assessment table you can include all your assets as well any hazards associated with them. You can edit it as per your requirement.
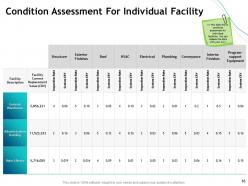
Slide 16: This slide shows condition assessment for individual facilities. You can replace the data with your own.
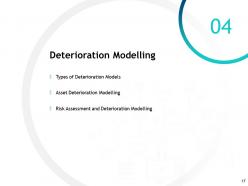
Slide 17: This slide depicts Deterioration Modelling.
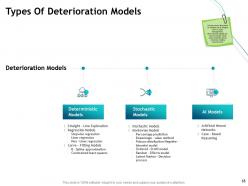
Slide 18: This slide depicts Types Of Deterioration Models ience's attention.
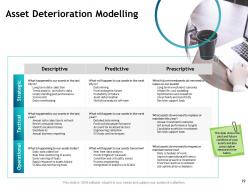
Slide 19: This slide shows the past and future condition of your assets and also prescriptive measures to be taken.
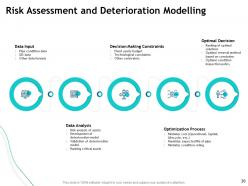
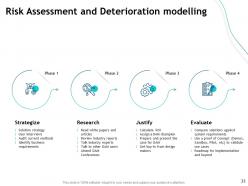
Slide 20: This slide showcases Risk Assessment and Deterioration Modelling
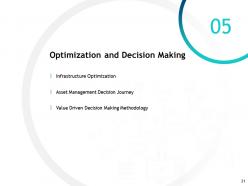
Slide 21: This slide depicts Optimization and Decision Making.
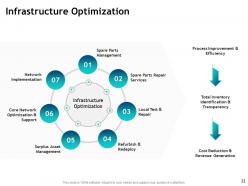
Slide 22: This slide shows Infrastructure Optimization.
Slide 23: This slide shows Risk Assessment and Deterioration modelling.
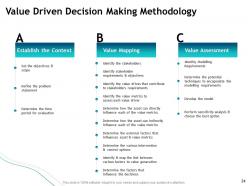
Slide 24: This slide presents Value Driven Decision Making Methodology.
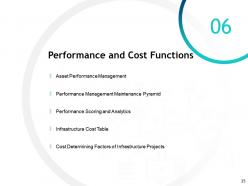
Slide 25: This slide shows Performance and Cost Functions
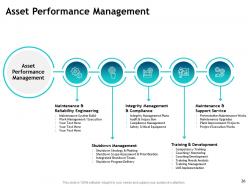
Slide 26: This slide displays Asset Performance Management.
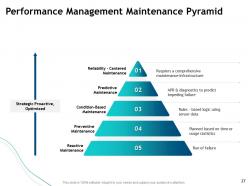
Slide 27: This slide shows Performance Management Maintenance Pyramid.
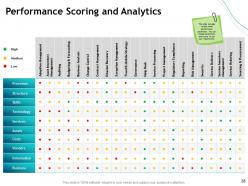
Slide 28: This slide includes various asset performance parameter. You can change parameters and scores to suit your requirement.
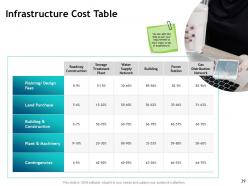
Slide 29: This slide presents Infrastructure Cost Table. You can edit this slide as per your requirement to show major areas of expenditure.
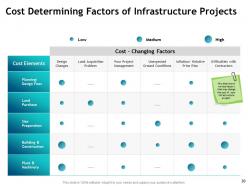
Slide 30: This slide shows various factors that may change the cost of your infrastructure project.
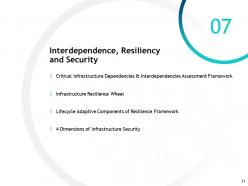
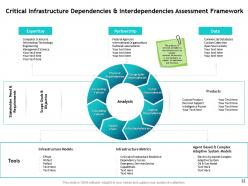
Slide 31: This slide shows Critical Infrastructure Dependencies & Interdependencies Assessment Framework
Slide 32: This slide depicts Critical Infrastructure Dependencies & Interdependencies Assessment Framework
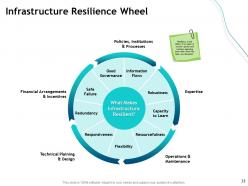
Slide 33: This slide showcases Infrastructure Resilience Wheel.
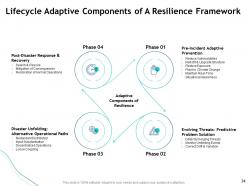
Slide 34: This slide shows Lifecycle Adaptive Components of A Resilience Framework.
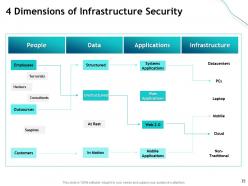
Slide 35: This slide presents 4 Dimensions of Infrastructure Security.
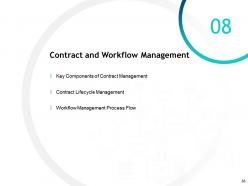
Slide 36: This slide displays Contract and Workflow Management.
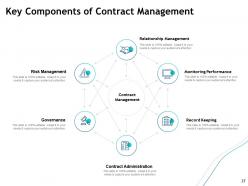
Slide 37: This slide shows Key Components of Contract Management
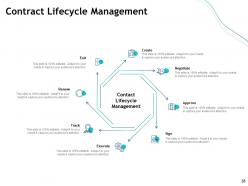
Slide 38: This slide shows Contract Lifecycle Management
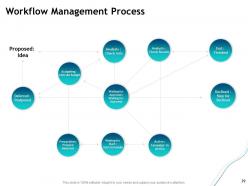
Slide 39: This slide depicts Workflow Management Process.
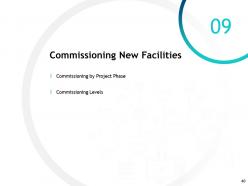
Slide 40: This slide presents Commissioning New Facilities.
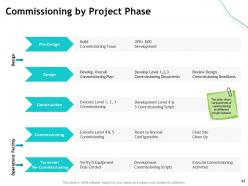
Slide 41: This slide shows various levels of commissioning at different project phases
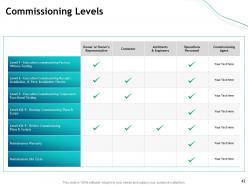
Slide 42: This slide depicts Commissioning Levels
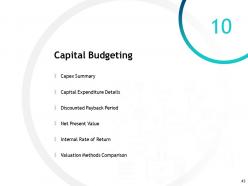
Slide 43: This slide shows Capital Budgeting.
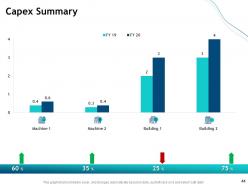
Slide 44: This slide presents Capex Summary.
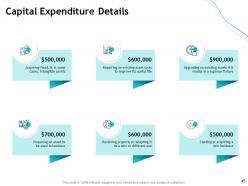
Slide 45: This slide presents Capital Expenditure Details.
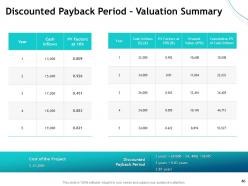
Slide 46: This slide showcases Discounted Payback Period – Valuation Summary
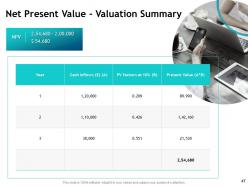
Slide 47: This slide presents Net Present Value - Valuation Summary
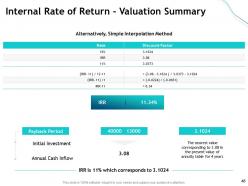
Slide 48: This slide showcases Internal Rate of Return - Valuation Summary
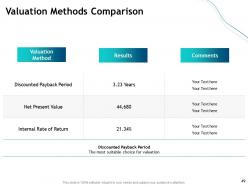
Slide 49: This slide depicts Valuation Methods Comparison
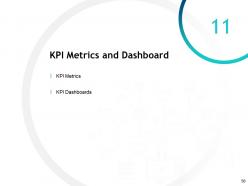
Slide 50: This slide displays KPI Metrics and Dashboard.
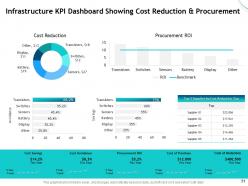
Slide 51: This slide depicts Infrastructure KPI Dashboard Showing Cost Reduction & Procurement
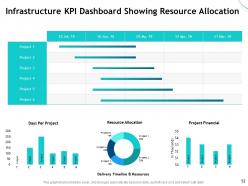
Slide 52: This slide shows Infrastructure KPI Dashboard Showing Resource Allocation
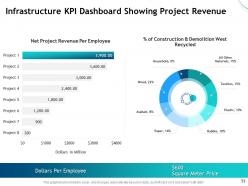
Slide 53: This slide presents Infrastructure KPI Dashboard Showing Project Revenue
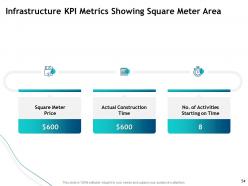
Slide 54: This slide depicts Infrastructure KPI Metrics Showing Square Meter Area.
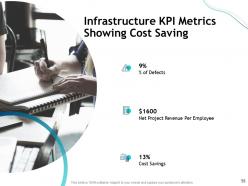
Slide 55: This slide shows Infrastructure KPI Metrics Showing Cost Saving
Slide 56: This slide reminds to take Coffee break.
Slide 57: This is Detailed Infrastructure Analysis Icons Slide.
Slide 58: This slide is titled as Additional Slides for moving forward.
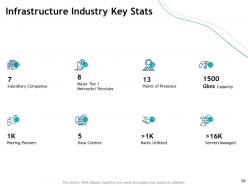
Slide 59: This slide depicts Infrastructure Industry Key Stats
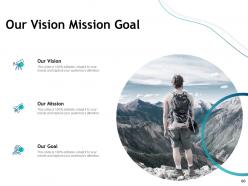
Slide 60: This slide displays Our Vision Mission Goal.
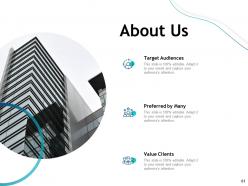
Slide 61: This is About Us slide to showcase Company specifications.
Slide 62: This is Our Team slide with Names and Designation.
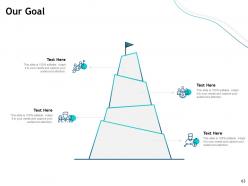
Slide 63: This is Our Goal slide. Showcase Important goals of the company.
Slide 64: This slide depicts Location.
Slide 65: This slide is titled as Post it Notes. Post your important notes.
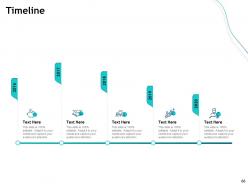
Slide 66: This slide shows Timeline process.
Slide 67: This is Bulb or Idea slide.
Slide 68: This is Thank You slide with Contact details.
Detailed infrastructure analysis powerpoint presentation slides with all 68 slides:
Use our Detailed Infrastructure Analysis Powerpoint Presentation Slides to effectively help you save your valuable time. They are readymade to fit into any presentation structure.


FAQs for Detailed infrastructure analysis
Start with five key things: how stuff physically looks, whether systems are maxed out, age/maintenance issues, reliability, and costs. Bridge ratings and road conditions are good indicators. Water leaks, power outages - that kind of stuff. Honestly, the data gets pretty messy fast, so grab your region's infrastructure report card first if there is one. Watch for systems running over 80% capacity - that's when things get sketchy. I'd build a simple tracker to spot problems early. Way easier than dealing with a crisis later.
Good infrastructure is like having a solid foundation - businesses can actually move stuff around cheaply and keep the lights on. Roads, power, internet that works means companies don't waste money on workarounds. Plus skilled people want to live where things actually function, you know? Bad infrastructure kills everything though. It's wild how much it ripples out - people can get to schools and hospitals easier, which helps the whole economy. Every infrastructure dollar usually creates like 2-3 more in economic activity. Don't forget about regulations and institutions too, not just the physical stuff.
So basically tech is what makes old infrastructure actually work again. IoT sensors track everything - bridge stress, water pressure, you name it. AI can predict when stuff's gonna break before it happens, which saves a ton of headaches. Digital twins let you test changes without screwing anything up in real life. Smart grids are pretty slick too - they'll reroute power automatically during outages. The cool part is how all these systems actually communicate now instead of working separately. I'd start with whatever's causing you the biggest problems and find tech that tackles those issues first.
So basically public-private partnerships are when the government teams up with private companies to build stuff. Makes sense because the government has the regulatory power and long-term planning, while private companies bring the money, expertise, and honestly just move faster. They split the risks too which is smart. I've seen this work really well for big infrastructure projects that would be a nightmare for either side to handle solo. Private companies actually care about quality since their reputation's on the line. Next time you're thinking about a major project, just figure out who's better at what and divide it up that way.
Use a weighted scoring system - it's honestly your best bet here. Score each project on safety urgency, cost-benefit ratio, funding availability, and community support. Don't get stuck overthinking it though. I've watched teams spin their wheels for months on this stuff. Start simple with your top 10 projects and maybe 3-4 main criteria. You can always tweak later. Oh, and definitely weigh maintenance backlogs against new construction - that balance trips up a lot of people. The key is just picking consistent criteria and running with it.
Dude, you can't just slap infrastructure anywhere without checking the environment first. Climate, soil, flood zones, earthquakes - all that stuff matters big time. I've seen projects go way over budget because someone skipped the environmental homework. Rain patterns affect your drainage, extreme temps mess with materials, and don't get me started on building near protected wildlife areas. The regulatory nightmare alone will kill you. Oh, and soil conditions? Super boring but actually crucial for foundations. Start that environmental assessment early or you'll hate yourself later. Trust me on this one.
So there's basically three things you need to nail: use materials that'll actually last through climate changes, build renewable energy in from day one (not as an afterthought), and design stuff that can be repurposed later. Most projects totally bomb because they're only thinking like 5 years ahead instead of 50. Green building standards are obviously key, plus nature-based stuff like bioswales for managing stormwater. Multi-modal transport too. The real trick though? Build your sustainability metrics right into those initial feasibility studies. Otherwise you're just slapping bandaids on bad design. Maybe start by looking at your current projects through this lens first.
Honestly, getting the community involved early saves you SO much trouble later. Locals know stuff you'd never think of - weird flooding spots, traffic nightmares, that kind of thing. They're also way less likely to throw a fit about projects they actually helped plan. I've watched perfectly good infrastructure plans completely crash and burn because no one bothered asking residents what they thought first. The local knowledge alone is worth it, but you also build actual trust and sometimes people come up with solutions that are way better than your original idea. Just don't wait until after you've designed everything - that's too late.
So basically, you can use data analytics to watch your infrastructure in real-time and actually predict when stuff's gonna break before it happens. Pretty wild how much you can learn from sensor data these days. Monitor energy usage, track wear patterns, optimize when you do maintenance - all that good stuff. The big wins? Less downtime, lower costs, equipment lasts way longer. You'll catch inefficiencies you didn't even know existed. My advice - don't go crazy at first. Just pick one important system, throw some sensors on it, and start gathering basic performance data. Build from there.
Honestly, the money part is brutal - we're talking billions upfront and investors hate waiting 20+ years to see returns. Public budgets? Always broke. Politicians make it worse since they want flashy wins before the next election, not some bridge that finishes after they're gone. Risk allocation becomes this whole nightmare too. Then you've got procurement red tape, regulatory stuff, and like five different groups all wanting different things. Oh and coordination meetings - so many meetings. My take? Get tight with the finance people from day one and always have Plan B (and C) ready before you even walk into that first pitch.
Look, old infrastructure is genuinely terrifying when you think about it. Water pipes can leak nasty stuff into your drinking water. Bridges and roads fall apart, causing more crashes. Electrical grids from like the 1960s? They'll catch fire or just die during heat waves. But gas lines scare me the most - one tiny leak and boom, your whole block's gone. Don't even get me started on sewage systems that can't handle storms anymore. Poor neighborhoods always get hit worst because they can't just pack up and leave. Really wish cities would fix this stuff before it breaks instead of waiting for disasters.
Dude, the predictive maintenance stuff is crazy - AI can literally catch infrastructure issues before they blow up. Digital twins are huge too, basically modeling entire cities in real-time. Singapore and Barcelona have some sick case studies on this if you wanna dive deeper. IoT sensors are collecting insane amounts of data everywhere now. Smart grids automatically balance energy distribution, which honestly should've been a thing way sooner. Traffic systems are finally getting smarter too, responding to actual conditions instead of those annoying preset timers we're all stuck with.
Okay so basically you've got three big things to tackle: upgrading your actual infrastructure, getting your planning sorted out, and building backup systems. First thing - do a climate vulnerability assessment to figure out what's gonna hit you hardest (flooding, heat waves, whatever). Then start retrofitting the critical stuff like power grids and water systems with materials that can actually handle extreme weather. Planning is honestly just as crucial as the physical work though - you need backup systems and alternative routes so you're not totally screwed when things inevitably fail. Oh, and definitely start with your most critical assets first.
Start with auditing what you've got - half the battle is just knowing what's actually out there. Focus your money on the stuff that'll really screw you over if it breaks. Regular inspections are huge, but honestly keeping the database current is a pain that everyone skips. Life-cycle analysis helps you figure out patch vs. replace decisions. Don't forget about traffic disruption costs when you're budgeting - those add up fast. Oh, and environmental impacts matter too now. Build your action plan around what's most critical first, then work down from there with realistic timelines.
Dude, regulations literally control everything about infrastructure projects. Timelines, costs, what tech you can even use - all of it. Clear rules actually help because you know what you're dealing with upfront. But messy, complicated frameworks? Total nightmare. I watched one project sit in permit hell for like three years, no joke. Good regulation finds that sweet spot between keeping things safe and not drowning you in red tape. Honestly, check out how your local planning office handles stuff before you dive into anything big. Trust me on this one.
-
Nice and innovative design.
-
Easy to edit slides with easy to understand instructions.
-
Appreciate the research and its presentable format.
-
Professional and unique presentations.
-
Perfect template with attractive color combination.