


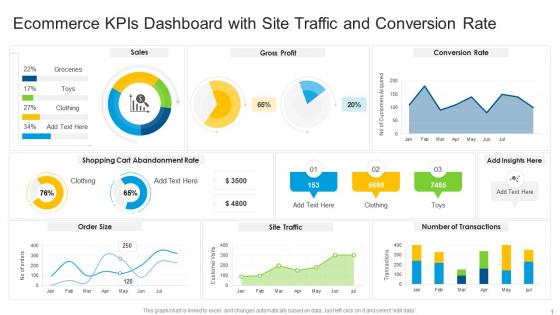
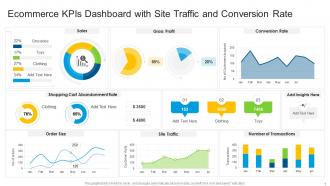
Ecommerce kpis dashboard snapshot with site traffic and conversion rate




Try Before you Buy Download Free Sample Product
 Impress Your
 Audience
 100%
100% Editable
 Save Hours
 of Time


Our Ecommerce KPIs Dashboard Snapshot With Site Traffic And Conversion Rate are topically designed to provide an attractive backdrop to any subject. Use them to look like a presentation pro.
People who downloaded this PowerPoint presentation also viewed the following :
Ecommerce kpis dashboard snapshot with site traffic and conversion rate with all 2 slides:
Use our Ecommerce KPIs Dashboard Snapshot With Site Traffic And Conversion Rate to effectively help you save your valuable time. They are readymade to fit into any presentation structure.
FAQs for Ecommerce kpis dashboard snapshot with site traffic
Honestly, I'd start with conversion rate - that's your bread and butter right there. Customer acquisition cost and lifetime value are huge too since they tell you if you're actually making money or just burning cash. Cart abandonment rate kills me every time I see mine spike, but it's super telling about your checkout process. Average order value matters obviously, and if you've got any subscription stuff, track that monthly recurring revenue religiously. Return customer rate is clutch too - shows if people actually like what you're selling. I usually check the main ones weekly, then worry about the fancy metrics later.
Dude, conversion rate is like your secret weapon for making more money without blowing your ad budget. Picture this - you've got 1000 people hitting your site but only 1% actually buy something. That's 10 sales, right? But if you can get that up to 3%, boom - you just made 30 sales from the exact same traffic. Way better than throwing more cash at Facebook ads, honestly. I always tell people to look at their checkout process first - it's usually a mess. Fix the obvious stuff there and on your product pages. Those tweaks can double your sales pretty quick, and you're not spending extra to get more visitors.
So AOV is like your secret weapon for making more money without the headache of finding new customers. Bump it from $50 to $75? That's 50% more revenue from the same people already shopping with you. Way easier than customer acquisition, which honestly just burns through cash. Try bundles, upsells, or that classic "free shipping over $X" trick - works every time. Suggesting related products helps too. The cool thing is you're working with people who already trust you enough to buy. Check your numbers weekly and test what actually works for your crowd.
So CAC is just total acquisition costs divided by new customers for that period. Pretty straightforward math. But here's where people mess up - they only count ad spend and forget about salaries, tools, all that other stuff that actually costs money. I'd track it monthly and break it down by channel. Otherwise you're flying blind on what's working. Your CAC should be like 3x less than customer lifetime value, bare minimum. Honestly, I'd start with last quarter's data and sort by traffic source first. You'll probably find you're hemorrhaging cash somewhere stupid. Been there.
CLV shows you what customers are actually worth long-term, not just that first sale. Way more useful than obsessing over conversion rates (though those still matter obviously). You can figure out your real acquisition budget, spot which marketing channels bring quality customers, and decide when to focus on keeping people vs. getting new ones. Honestly, most businesses are terrible at this - they chase shiny new customers while ignoring the goldmine they already have. Start tracking it by customer type so you'll see who's really driving growth.
Peak season? Focus on conversion rates and whether your site can actually handle the traffic surge. Page load times are make-or-break - people bounce if it's slow, especially during holiday madness. Watch your cart abandonment like a hawk too. Inventory turnover matters more than total visitors honestly. Also track fulfillment stuff - order processing times, shipping delays, the works. You don't want to crush the sale then totally botch delivery (been there, it sucks). Set up real-time dashboards so you're not scrambling when things inevitably go wrong.
Honestly, the checkout thing is huge - ditch those extra form fields nobody wants to fill out and let people buy without creating accounts. Show shipping costs right away too, not at the very end when people freak out about surprise fees. Payment options matter more than you'd think. Trust badges help but don't go crazy with them. Track your abandonment rate weekly - it's just initiated checkouts minus completed ones, divided by initiated checkouts. Shopify does this automatically which is nice. Send those recovery emails fast, like within an hour or three max. That's when people actually convert instead of just ignoring them.
ROAS shows you whether your ads are making money or just draining your wallet. Anything 4:1 or higher for ecommerce? You're golden - pump more money into those campaigns. Bad ROAS usually means wrong audience, crappy creative, or your landing page is trash. Sometimes it's all three, which honestly happens more than you'd think. I check mine daily because it helps me figure out where to move budget around. The whole point is spotting your winners fast and killing the losers even faster. It's pretty much the best way to avoid throwing good money after bad campaigns.
Send a quick survey after people buy asking "how likely are you to recommend us" on a 0-10 scale. Simple math - subtract your detractors (0-6 scores) from promoters (9-10). Typeform works, but honestly even basic email surveys do the job. People bail on anything too long anyway. The real gold is in following up - ask detractors what went wrong, then actually fix that stuff. Your promoters? Hit them up for reviews since they're already happy. I'd track it monthly and see how tweaks to shipping or checkout affect the numbers. Way more useful than just collecting scores.
Focus on conversion rate, average order value, and cart abandonment first - those three are huge. Conversion rate shows if your site actually sells stuff, not just gets traffic. AOV tells you what each customer's worth. Cart abandonment is honestly depressing to look at but super useful for finding where people bail out. I'd also watch page speed (slow sites kill sales), bounce rate, and which traffic sources actually convert instead of just sending tire-kickers. Return visitor percentage is good too. Start there and you'll catch most issues before they tank your revenue.
Yeah, so engagement and sales definitely connect, but not how you'd think. Likes and comments usually boost your traffic first, then actual sales show up like 30-60 days later. It's weird timing honestly. Track your engagement rate against website visits from social, then see how many of those people actually buy stuff. Don't get too excited if a post goes viral though - that doesn't automatically mean money. Consistency matters way more than one-hit wonders. Building trust takes time, but that's where the real conversions happen.
Honestly, start with personalization - that's what actually converts. Dynamic product recs based on what people browsed, one-click checkout, mobile optimization (seriously, mobile is where you're probably bleeding customers). Push notifications can be clutch but don't spam people or they'll just turn them off. Gamification helps too - loyalty points, those little progress bars during checkout. Makes it feel less transactional, you know? I'd focus on your busiest pages first and A/B test small stuff before doing anything major. Oh, and test everything on your phone - desktop shoppers are basically extinct at this point.
So GA4 has this device segmentation feature that's actually pretty useful - it automatically splits your data by mobile, desktop, and tablet. Check your conversion rates and bounce rates across devices first. Mobile traffic is usually way higher but converts worse, which is totally normal so don't stress about that. I'd focus on revenue per visitor since that gives you the real picture. You can set up custom dashboards or honestly, Hotjar's heatmaps are great for seeing how people actually use each device. Start by comparing last month's mobile vs desktop conversions - that'll tell you where to focus your energy.
So basically, high inventory turnover is like your secret weapon for being more sustainable. You're moving stuff fast instead of having it sit there forever until it becomes trash. Quick turnover means less overstock heading to landfills, lower storage costs, and way fewer products going obsolete. Your supply chain gets more efficient too - less pointless shipping and warehousing that burns through fuel. Most industries should hit 6-12 turns per year, though honestly that varies a ton. I'd check your numbers monthly and tweak your buying based on what you see.
Oh man, you HAVE to segment your KPIs - seriously one of the biggest game-changers. Aggregate numbers are basically useless because different customer groups act totally different. Your Gen Z crowd might convert like crazy but spend nothing, while boomers are the opposite. I learned this the hard way last year actually. Break down your top 3 KPIs by age and traffic source first - that's where I'd start. Then add location, how they found you, purchase history, whatever. The patterns that show up will blow your mind. You're missing huge optimization wins without this.
-
Great designs, Easily Editable.
-
Thanks for all your great templates they have saved me lots of time and accelerate my presentations. Great product, keep them up!