


Expense Trend Analysis Status Report




Try Before you Buy Download Free Sample Product
 Impress Your
 Audience
 100%
100% Editable
 Save Hours
 of Time


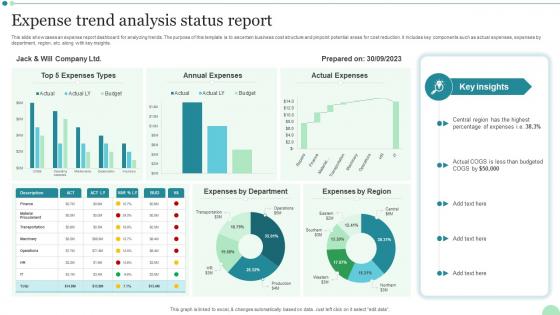
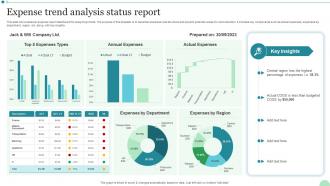
This slide showcases an expense report dashboard for analyzing trends. The purpose of this template is to ascertain business cost structure and pinpoint potential areas for cost reduction. It includes key components such as actual expenses, expenses by department, region, etc. along with key insights.
People who downloaded this PowerPoint presentation also viewed the following :
Expense Trend Analysis Status Report with all 10 slides:
Use our Expense Trend Analysis Status Report to effectively help you save your valuable time. They are readymade to fit into any presentation structure.








FAQs for Expense Trend
Okay so for expense analysis, you basically need five things. First, categorize everything - fixed vs variable, operational vs capital stuff. Track your spending trends over time too. Then benchmark against industry standards or whatever budget you set. Most people totally mess up the variance analysis part, but that's where you find the real issues. Calculate ratios like expense-to-revenue. Oh and look at departmental breakdowns if that applies to you - seasonal patterns matter too. Honestly though, start with clean data and proper categories first. Everything else is pointless if your foundation sucks.
Start by splitting fixed stuff (rent, utilities, payroll) from the variable costs like marketing and travel. Software is a big one - if you're spending tons there, don't just lump it with "office expenses." Break down marketing too. Paid ads vs content creation, that kind of thing. Honestly, the biggest thing is getting everyone to categorize stuff the same way. Set this up in your accounting software from day one or you'll hate yourself come month-end. Trust me on that one - been there.
Honestly, just start with Excel or Google Sheets for basic expense stuff - they're still solid for categorization and tracking trends. Power BI or Tableau are worth it if you want decent dashboards that people will actually use (and understand). QuickBooks is good when you need the accounting side built in too. Bigger companies usually go with SAP or Oracle, but that's probably overkill unless you're dealing with tons of data. My advice? Don't get caught up in the shiny new tools - pick whatever matches your data complexity and what your team can handle without wanting to quit.
Do it monthly at minimum - catches any weird spending before it gets out of hand. But quarterly is honestly where you'll see the bigger picture stuff. I've watched companies panic at year-end when they realize their software costs have gone completely insane. The trick is just being consistent with whatever schedule you pick. Monthly for quick checks, quarterly for the deeper dive into trends. Don't be too ambitious though - better to actually stick with something simple. Trust me, you'll be so glad you did this when budget planning hits.
You can't really build a decent budget without knowing where your money's actually going first. Go through your last 12 months of expenses and break them into categories - trust me, you'll spot patterns you totally missed before. Those trends show you seasonal spikes and sneaky cost creep (seriously, when did I start paying for six different streaming services?). Once you see your real spending habits, you can set budgets that aren't just fantasy numbers. Your forecasts get way more accurate too since they're based on what you actually do with money, not what you think you should do.
So expense analysis is basically seeing where your cash actually disappears to - and trust me, it's always surprising. First thing is to grab like 3-6 months of spending and sort everything into categories. Then you're hunting for the weird stuff: duplicate subscriptions, overpriced vendors, departments buying random things they never touch. Companies literally find thousands in unused software licenses all the time. Look for patterns and outliers over a few months. Once you've got that mess figured out, you can negotiate better deals or just axe the obvious waste. Honestly the categorizing part is tedious but worth it.
Track your total spend and break it down by category first - that's your foundation. Then get into cost per unit, vendor performance, and how things trend over time. Honestly, most people skip approval cycle times but that metric's gold for spotting where things get stuck. Also watch compliance stuff like policy adherence and whether people actually submit receipts on time (spoiler: they don't). The thing that'll save your sanity? Set up automated alerts when numbers hit certain thresholds. Way better than discovering problems after they've already blown up your budget.
Yeah, so expense analysis is totally different depending on your industry. Manufacturing companies obsess over raw materials and production costs. Service businesses? It's all about labor and overhead expenses. Tech companies dump crazy money into R&D (honestly, they have to). Retail focuses more on inventory turnover and supply chain stuff. You've got to think about your industry's specific quirks too - like regulatory costs, seasonal ups and downs, whether you're capital-heavy or not. I'd start by checking what your competitors spend. That'll show you if you're way off track somewhere.
Biggest mistake? Looking at expenses one by one instead of the whole picture. Teams waste weeks analyzing old data that's already useless - super frustrating to watch. Don't get stuck cutting tiny costs while massive inefficiencies drain your budget elsewhere. Inconsistent expense categories will mess up any trend analysis you're trying to do. Monthly reviews beat quarterly ones since you can actually fix problems before they spiral. Oh, and the numbers mean nothing if you don't understand why people are spending that way in the first place. Set clear categories from day one.
Looking at your old expenses is honestly a game-changer for budgeting. Pull like 12-24 months of data and sort it into categories - the patterns that show up will blow your mind. I'm always shocked at how much we spend on random stuff in December (holiday parties add up fast). You'll catch those seasonal spikes, see where money consistently disappears, and actually set realistic budgets instead of throwing darts at numbers. Plus you can figure out what's actually worth spending on versus what's just fluff. Trust me, it beats guessing every time.
Honestly, the game-changer is capturing receipts right when you spend the money - your phone camera is your best friend here. Set up those automated rules to sort expenses into categories so you're not doing it manually every time. Multiple people reviewing stuff catches way more mistakes than I expected when we started doing it. Connect your credit cards directly so transactions populate automatically, then you just double-check instead of typing everything from scratch. Oh, and write super clear policies with actual examples - saves so much confusion later. Make the right way the easy way, you know?
Okay so here's what I do - put all those random one-time costs in their own bucket. Equipment, legal stuff, repairs, whatever. Otherwise they'll mess up your monthly averages and you'll think you're bleeding money when really you just bought a new printer or something. I learned this the hard way after freaking out over what looked like a terrible February that was actually fine except for one big expense. Look at a full year's worth of data too, not just month-to-month. Some patterns only show up when you zoom out. Keep both views going - monthly for the day-to-day stuff, but that 12-month rolling view will save your sanity.
Dude, external stuff can totally screw up your expense analysis if you're not watching for it. Inflation hits everything - supply costs, labor, you name it. Interest rates mess with your financing costs too. I found out the hard way that currency swings will wreck your international expenses (still annoyed about that one honestly). Market conditions change what vendors charge and whether you can even get what you need. You've gotta build these into your forecasts and keep updating your assumptions. Otherwise you're stuck comparing totally different situations year to year.
Honestly, charts and graphs are a game-changer for expense stuff. Nobody wants to stare at endless spreadsheet rows - I literally fall asleep. Pie charts work great for budget breakdowns, bar charts for comparing departments or months. Line graphs show trends over time really well. Your audience will actually absorb the info instead of zoning out. Plus they'll remember it later, which is kinda the whole point, right? I'd make like 2-3 different visual versions and see what clicks best with people.
Honestly, comparing your expenses to industry benchmarks is like getting a gut check on whether you're spending smart or just bleeding money. You'll quickly see if you're overpaying for stuff or missing out on investments your competitors are making. The best part? When vendors try to jack up prices, you can call BS because you actually know what market rates look like. I'd grab those industry reports every few months - maybe quarterly if you're feeling ambitious - and focus on your biggest expenses first. That's where the real savings live anyway. Plus stakeholders love it when you can back up budget decisions with actual data instead of just winging it.
-
A library of engaging, customizable and content-ready templates.
-
Their products can save your time, effort and money. What else you need. All in one package for presentation needs!