


Apresentação em PowerPoint de análise de lacunas com slides





Try Before you Buy Download Free Sample Product
 Impress Your
 Audience
 100%
100% Editable
 Save Hours
 of Time


Elaborar um bom exemplo frutífero de PPT na análise de lacunas pode ser um desafio para você. Para ajudá-lo aqui, estamos apresentando apresentação de slides completa do PowerPoint para ilustrar pictoricamente um processo de análise de lacunas ou modelo de análise de lacunas. Bem aplicável a todos os negócios, atua como uma ferramenta potencial para descobrir as prioridades necessárias para realizar a melhoria. O mais empolgante é que você também pode aplicar nosso modelo PPT pronto para comparar o desempenho de seus funcionários, a fim de quantificar a disparidade entre o desempenho atual e o desejado. Além disso, uma comunicação visual feita com o auxílio de nosso deck de apresentação ajuda a capacitar os funcionários para um diagnóstico rápido de um problema. Além disso, para cobrir todos os aspectos necessários aqui, incluímos temas de modelo como gráficos de análise de lacunas, gráfico de análise de lacunas básico, procedimento de análise de lacunas etc. Em suma, você pode agregar valor aos seus processos de negócios discutindo exaustivamente uma análise de lacunas de negócios com a ajuda de nosso PPT de apresentação de amostra readymade. Portanto, baixe rapidamente nosso arquivo de amostra PPT de análise de lacunas de desempenho e comece imediatamente. Evite a formalidade excessiva com nosso pacote completo de PowerPoint com slides para análise de lacunas. Permita a existência de mais liberdade.
People who downloaded this PowerPoint presentation also viewed the following :
Conteúdo desta apresentação em PowerPoint
Slide 1 : Este slide apresenta a análise de lacunas. Indique o nome da sua empresa e comece.
Slide 2 : Este é um slide da agenda. Declare suas agendas aqui.
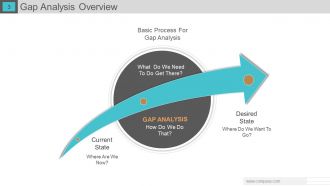
Slide 3 : Este slide apresenta uma Visão Geral da Análise de Lacunas com os seguintes pontos - Processo Básico para Análise de Lacunas, Estado Atual, Estado Desejado, Para Onde Queremos Ir? Como fazemos isso? O que precisamos fazer para chegar lá? Onde estamos agora?
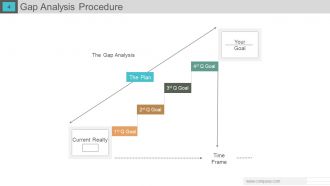
Slide 4 : Este slide mostra o procedimento de análise de lacunas com - Período de tempo, Análise de lacunas, Seu objetivo, Realty atual.
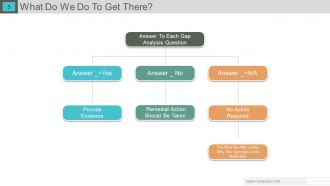
Slide 5 : Este slide apresenta o que fazemos para chegar lá?
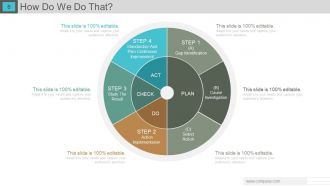
Slide 6 : Este slide apresenta como fazemos isso?
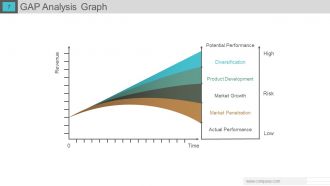
Slide 7 : Este slide apresenta um gráfico de análise de GAP com - Desempenho real, desempenho potencial Diversificação Desenvolvimento de produto Crescimento do mercado Receita de penetração do mercado em termos de tempo, baixo-alto risco.
Slide 8 : Este slide mostra a missão da empresa de análise do estado atual, declarando nossa missão.
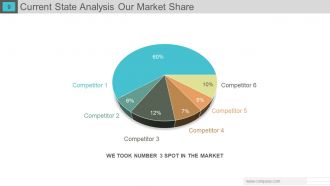
Slide 9 : Este slide mostra a análise do estado atual de nossa participação de mercado na forma de gráfico de pizza.
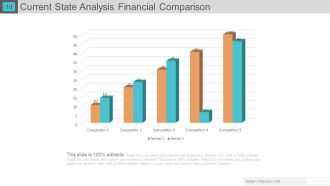
Slide 10 : Este slide mostra o gráfico de Comparação Financeira da Análise do Estado Atual.
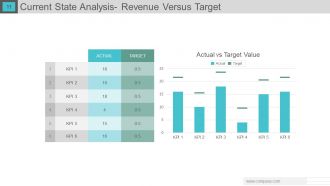
Slide 11 : Este slide mostra a análise do estado atual - receita versus meta com gráficos separados de - valor real x alvo, real - meta
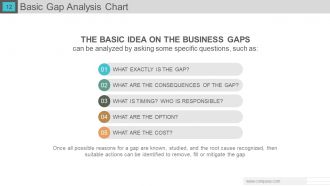
Slide 12 : Este slide apresenta o gráfico de análise de lacunas básicas com os seguintes pontos - O que exatamente é a lacuna? Quais são as consequências da lacuna? O que é tempo? quem é responsável? Quais são as opções? Quais são os custos?
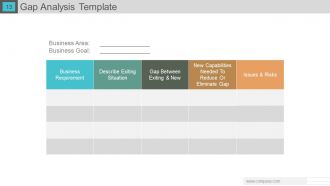
Slide 13 : Este slide apresenta um modelo de análise de lacunas com - Área de negócios, Meta de negócios.
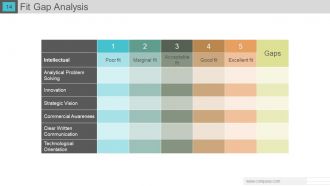
Slide 14 : Este slide apresenta uma tabela Fit Gap Analysis.
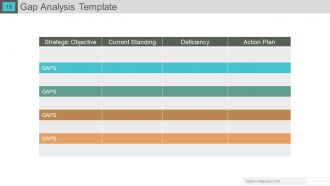
Slide 15 : Este slide mostra um modelo de análise de lacunas.
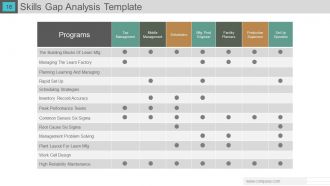
Slide 16 : Este slide mostra um modelo de análise de lacuna de habilidade.
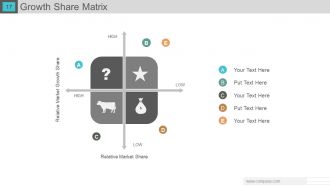
Slide 17 : Este slide mostra uma Matriz de Participação de Crescimento para exibir informações, especificações, etc.
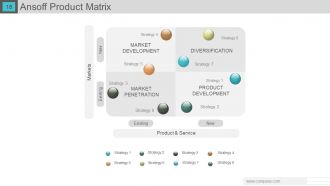
Slide 18 : Este slide mostra uma Matriz de Produto Ansoff com - Produto e Serviço, Novo, Existente, Desenvolvimento de Mercado, Penetração de Mercado, Diversificação, Desenvolvimento de Produto.
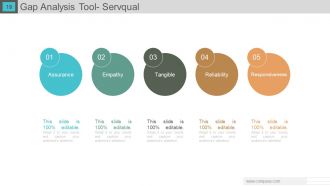
Slide 19 : Este slide apresenta a Ferramenta de Análise de Lacunas - Servqual com os seguintes pontos - Garantia, Empatia, Tangível, Confiabilidade, Capacidade de Resposta.
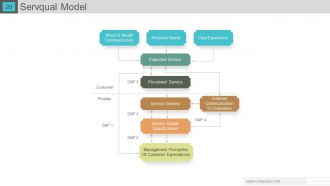
Slide 20 : Este slide apresenta um modelo Servqual com os seguintes pontos - comunicação boca a boca, percepção da gestão das expectativas do cliente, necessidades pessoais, experiência anterior, serviço percebido, entrega de serviço, especificações de qualidade do serviço, comunicação externa aos clientes, serviço esperado, cliente , Provedor, GAPS.
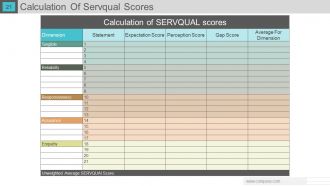
Slide 21 : Este slide apresenta a tabela Cálculo de pontuações de Servqual.
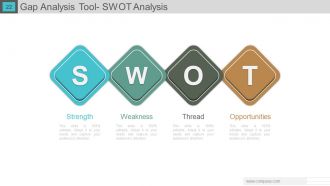
Slide 22 : Este slide mostra a Ferramenta de Análise de Lacunas - Análise SWOT.
Slide 23 : Este slide apresenta a Ferramenta de Análise de Lacunas - Análise de Espinha de Peixe 6 Sra. Elas são - Máquinas, Recursos Humanos, Método, Material, Manutenção, Efeito Mãe Natureza.
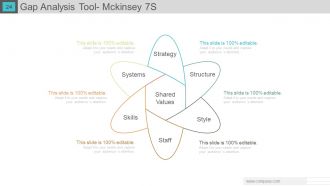
Slide 24 : Este slide apresenta a ferramenta de análise de lacunas - Mckinsey 7S. Eles são- Valores Compartilhados, Estratégia, Estrutura, Estilo, Equipe, Habilidades, Sistemas.
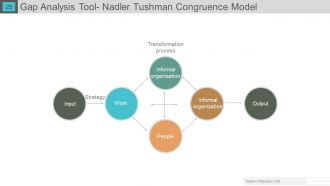
Slide 25 : Este slide mostra a Ferramenta de Análise de Lacunas - Modelo de Congruência Nadler Tushman. Os constituintes são: Trabalho, Organização informal, Pessoas, Estratégia, Saída, Entrada, Processo de transformação.
Slide 26 : Este slide é intitulado Slides adicionais para avançar. Você pode alterar o conteúdo conforme a necessidade.
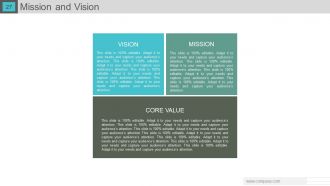
Slide 27 : Este slide apresenta a Missão e a Visão, mostrando a Visão, a Missão e o Valor Central.
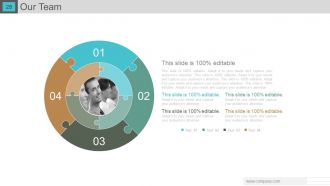
Slide 28 : Esta é uma caixa de imagem de slide como quebra-cabeça da Nossa Equipe com caixas de texto.
Slide 29 : Este é um slide sobre nós. Indique as especificações da empresa / equipe aqui.
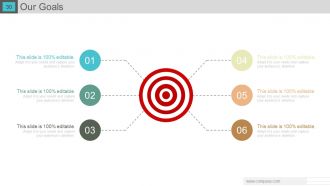
Slide 30 : Este é o slide Nossas Metas. Estabeleça metas, metas etc. aqui.
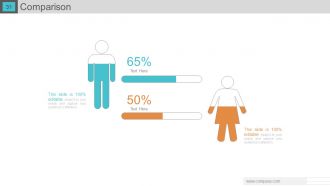
Slide 31 : Este é um slide de comparação para comparar duas entidades, etc.
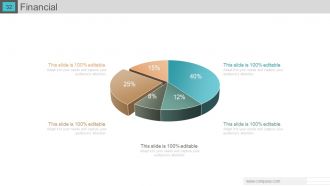
Slide 32 : Este é um slide de pontuação financeira. Indique os aspectos financeiros, etc. aqui.
Slide 33 : Este é um slide de cotações para transmitir a mensagem da empresa / organização, crenças, etc.
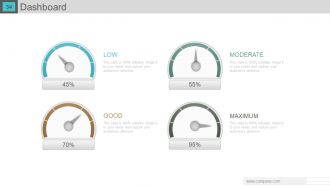
Slide 34 : Este é um slide do Dashboard para mostrar os fatores de crescimento em termos de Bom, Baixo, Máximo e Moderado.
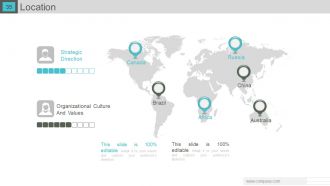
Slide 35 : Este é um slide de localização do mapa mundial para mostrar a presença global, crescimento, etc.
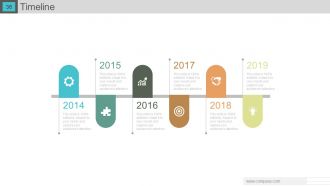
Slide 36 : Este é um slide de linha do tempo para mostrar o crescimento, destacando fatores, marcos etc.
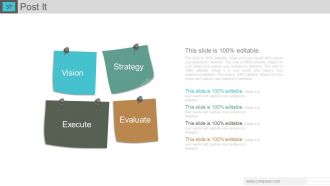
Slide 37 : Este é um slide Post It para mostrar - Avaliar, Estratégia, Visão, Executar.
Slide 38 : Este é um slide de Jornal para mostrar eventos, notícias, etc. Você pode alterar o slide de acordo com sua necessidade / exigência.
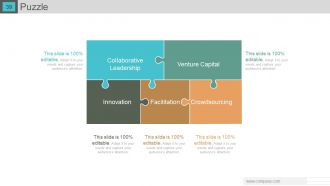
Slide 39 : Este é um slide de imagem de quebra-cabeça mostrando - Liderança Colaborativa, Empreendimento, Facilitação, Inovação, Crowdsourcing.
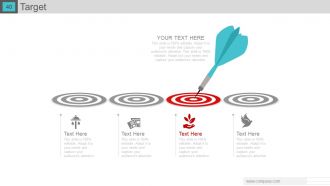
Slide 40 : Este é um slide de destino. Estabeleça metas, objetivos etc. aqui.
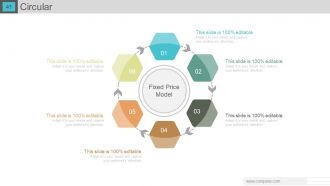
Slide 41 : Este é um slide de imagem circular que mostra o Modelo de Preço Fixo.
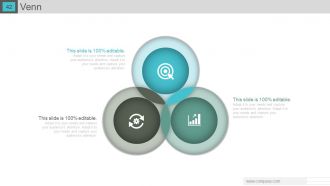
Slide 42 : Este é um slide de imagem do diagrama de Venn. Informações de estado, especificações etc. aqui.
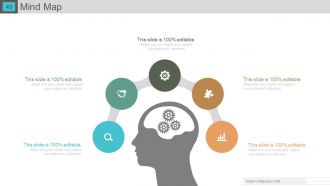
Slide 43 : Este é um slide de imagem do Mapa Mental. Informações de estado, especificações etc. aqui.
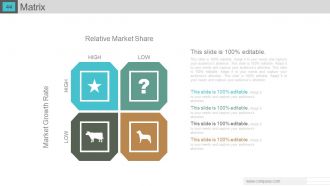
Slide 44 : Este slide apresenta uma matriz em termos de - Taxa de crescimento do mercado, Participação de mercado relativa, Alta, Baixa.
Slide 45 : Este é um slide de imagem Lego. Informações de estado, especificações etc. aqui.
Slide 46 : Este é um slide de imagem de silhuetas. Indique as informações relacionadas às pessoas, especificações, etc. aqui.
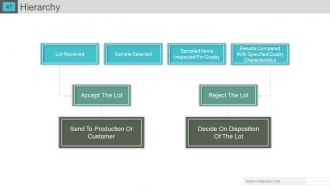
Slide 47 : Este slide apresenta uma hierarquia com o seguinte conteúdo - Lote recebido, Amostra selecionada, Itens amostrados inspecionados quanto à qualidade, Resultados comparados com as características de qualidade especificadas, Aceitar o lote, Rejeitar o lote, Enviar para produção ou cliente, decidir sobre a disposição de O lote.
Slide 48 : Este é um slide de imagem Bulbo / Idéia. Indique informações, especificações, aspectos inovadores, etc. aqui.
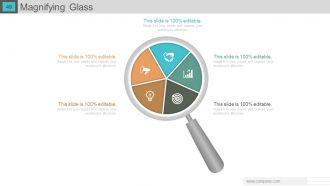
Slide 49 : Este é um slide de imagem de lupa. Informações de estado, especificações etc. aqui.
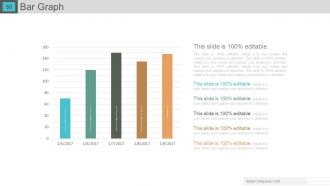
Slide 50 : Este é um slide de gráfico de barras para mostrar a comparação de produto / entidade.
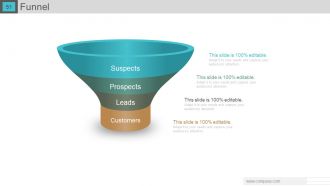
Slide 51 : Este é um slide de imagem de funil que mostra - Clientes, leads, clientes em potencial, suspeitos.
Slide 52 : Este é um slide de agradecimento para encerrar uma apresentação.
Análise de lacunas Apresentação em PowerPoint com slides com todos os 52 slides:
Reduza despesas extras com nosso Powerpoint Completo de Análise de Lacunas com Slides. Exibir grande eficiência econômica.
-
GAP Analysis
-
Agenda
-
Gap Analysis Overview
-
Gap Analysis Procedure
-
What Do We Do To Get There
-
How Do We Do That
-
GAP Analysis Graph
-

Current State Analysis Company s Mission
-
Current State Analysis Our Market Share
-
Current State Analysis Financial Comparison
-
Current State Analysis Revenue Versus Target
-
Basic Gap Analysis Chart
-
Gap Analysis Template
-
Fit Gap Analysis
-
Gap Analysis Template
-
Skills Gap Analysis Template
-
Growth Share Matrix
-
Ansoff Product Matrix
-
Gap Analysis Tool Servqual
-
Servqual Model
-
Calculation Of Servqual Scores
-
Gap Analysis Tool SWOT Analysis
-

Gap Analysis Tool Fishbone Analysis 6 MS
-
Gap Analysis Tool McKinsey 7S
-
Gap Analysis Tool Nadler Tushman Congruence Model
-
Additional Slides
-
Mission and Vision
-
Our Team
-

About Us
-
Our Goals
-
Comparison
-
Financial
-

Quotes
-
Dashboard
-
Location
-
Timeline
-
Post It
-

Technical Support News
-
Puzzle
-
Target
-
Circular
-
Venn
-
Mind Map
-
Relative Market Share Matrix
-
Lego
-
Silhouettes
-
Hierarchy
-
Idea Bulb
-
Magnifying Glass
-
Bar Graph
-
Funnel
-
Thank You
FAQs for Gap analysis powerpoint
So you'll need to nail down where you're at right now versus where you want to be - sounds obvious but most people skip this part. Gather solid data and actually talk to the people involved because their input matters way more than you'd think. Once you've mapped out those gaps, prioritize them. Some will be total dealbreakers, others can wait. Create a realistic timeline with specific steps and ways to measure if it's working. Oh, and be brutally honest about your current situation - I've seen so many of these fail because people weren't realistic from day one.
Start by collecting data and talking to stakeholders to figure out where you actually are right now. Document everything - your processes, what you're good at, what sucks. Be honest about it. Then nail down exactly where you want to be with real numbers and goals. Getting input from other departments is clutch since they'll catch things you're blind to. Here's the thing though - most people sugarcoat their current situation and that just screws you over later. Once you've got both states mapped out clearly, the gaps are pretty obvious and you can tackle the biggest ones first.
Honestly? SWOT analysis and benchmarking are your best bets - super easy to jump into. Skills matrices work great too. Performance dashboards get fancier if that's your thing, or capability maturity models for more structure. But real talk, I've seen teams get amazing results with just a basic spreadsheet doing "where we are vs where we wanna be." Value stream mapping is clutch for processes (seriously, it's like magic), and if you're doing strategic stuff, McKinsey 7S is solid. Just pick whatever won't overwhelm your team and actually stick with it. Analysis paralysis kills more projects than bad frameworks do.
So gap analysis is basically your roadmap from point A to point B. Shows you what's actually missing - could be money, skills, market share, whatever. Honestly, most people skip this step and wonder why they're stuck later. You'll spot which gaps need fixing first so you're not throwing money at the wrong problems. Plus it uncovers opportunities you totally missed and risks that could mess things up. The trick is being real about where you stand right now - no BS. Then you can actually build timelines that make sense and won't leave your team burnt out chasing impossible deadlines.
Definitely talk to your stakeholders early - they're the ones dealing with the actual problems day-to-day. Without their input, you'll miss the real pain points and end up with solutions nobody wants. I learned this the hard way on a project last year, honestly. Different people will give you totally different takes on the same issues, which is actually super helpful for figuring out priorities. Don't just chat with the usual management crew either. Get perspectives from various levels - the frontline folks often have the best insights about what's really broken.
Gap analysis is basically comparing where your project is now vs where it should be. Look at timeline, budget, resources, deliverables - whatever's relevant. Honestly, this saved my butt on a launch last year when I realized we were way behind on testing. The trick is being brutally honest about your current situation (no sugarcoating). Map out what's missing or delayed. Then you can actually fix the problems instead of pretending they don't exist. It's great for catching issues before they blow up your whole project.
Data quality issues will kill you every time - incomplete records, inconsistent formatting, the usual mess. Getting departments to agree on future goals? Good luck with that. Marketing wants one thing, operations wants another. Scope creep's brutal too since everyone thinks their process is the most critical one to analyze. Start small though - pick one area, nail down your baseline numbers first. Leadership alignment saves you tons of headaches later. Oh, and don't let people dump random "urgent" requests on you mid-project. Stay focused.
Honestly, just pick specific numbers to track before you start fixing anything. Like if communication was the problem, don't just say "it got better" - actually measure response times or how many projects finish on schedule. Set your baseline first, then check those same metrics every few months. I usually do quarterly reviews but whatever works. The whole point is seeing if you're actually moving the needle or just spinning your wheels. Oh and be super specific about what "success" looks like upfront. Otherwise you'll never know if you actually solved the problem or just made yourself feel better about it.
Oh totally! I do this for my career stuff constantly. Map out where you are right now vs where you wanna be, then figure out what's missing in between. Way better than just taking random classes and crossing your fingers, you know? Works for promotions, career switches, whatever. The trick is being super honest about your current skills - like painfully honest lol. Then get really specific about your goal role's requirements. Compare the two lists and boom, there's your roadmap. It's honestly kind of eye-opening once you see it all laid out like that.
Tech and healthcare companies do these all the time because regulations change constantly. Financial services too - they can't afford to mess up compliance. Manufacturing loves gap analyses for quality stuff, which makes sense. Really though, if screwing up costs you serious money or gets you in regulatory trouble, you should probably do them quarterly. Slower industries? Maybe you can get away with once a year. I mean, there's no point overdoing it if your market barely shifts. The trick is figuring out how fast your competition moves and matching that pace.
Dude, technology is a game-changer for gap analysis. Data analytics tools automatically catch patterns you'd never spot by hand - saves so much time. Real-time tracking through project management software is clutch too. I'm obsessed with those visual dashboards because they make presenting to higher-ups actually bearable. Oh, and automation can monitor your KPIs constantly and ping you when something's off. My advice? Don't go crazy trying to implement everything at once. Pick one tool that meshes with what you're already doing. You'll thank yourself later.
For your gap analysis, you'll need three main buckets of metrics. First up - performance stuff like KPIs, conversion rates, customer satisfaction. Basically how you're doing versus where you want to be. Resource metrics are more straightforward: budget, headcount, tech stack, time. Capability metrics though? That's where it gets messy. We're talking skill levels, how mature your processes actually are, knowledge gaps on the team. Super important but honestly a pain to quantify sometimes. Just start with whatever data you've got lying around already. Then pick 2-3 of the biggest gaps and focus there first.
Honestly, most people say once a year but that's kinda the bare minimum. Fast-moving industries? You're gonna want to check quarterly, maybe even more if things are really crazy. I mean, think about it - regulations change, markets shift, your whole digital setup evolves. These aren't meant to be those documents you create once and forget about in some folder somewhere. Tie your reviews to when you're already doing business planning anyway, makes it way easier. Oh, and definitely set actual calendar reminders because otherwise you'll totally forget.
So basically, quantitative gap analysis is all about the hard numbers - performance scores, percentages, that kind of stuff. Pretty straightforward to see where you stand. Qualitative is more like... getting into people's heads? You're doing interviews and surveys to figure out *why* gaps exist, not just that they do. Honestly, mixing both works best. Numbers show you the problem, but you need the stories behind them to actually fix anything. I'd probably start with the data first to spot issues, then talk to people to understand what's really going on. Makes way more sense than trying to guess.
Look, external factors totally flip your gap analysis on its head. The market decides what "winning" means - like when everyone suddenly cared about sustainability over cheap prices. Your current skills might look completely different now. Economic changes, new rules, competitor drama - it all moves the finish line you're measuring against. Honestly feels like whack-a-mole sometimes. You've got to keep updating what's happening externally or you'll be shocked when that tiny gap becomes this huge problem. I learned this the hard way last year. Always check the market situation before trusting old analysis.
-
Illustrative design with editable content. Exceptional value for money. Highly pleased with the product.
-
Unique design & color.