


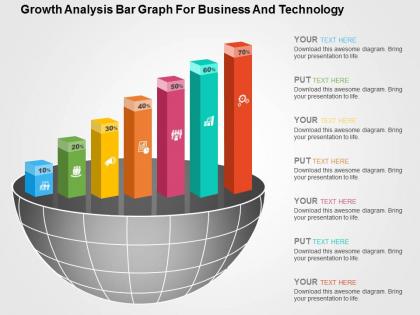
Growth analysis bar graph for business and technology flat powerpoint design




Try Before you Buy Download Free Sample Product
 Impress Your
 Audience
 100%
100% Editable
 Save Hours
 of Time


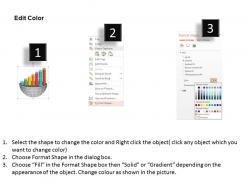
Highlight the growth concept in the business sector using growth analysis bar graph PowerPoint slide. There is no better way to present the company development than using the bar graphs. The provided bar graph presentation template is useful to show the key business statistics to your partners, stakeholders and even clients. Using this PPT design, you can present the details related to the success which you have achieved and compare it with your goals. Our designing experts have crafted this masterpiece with complete care to provide you the best resources for your next presentation. Bar charts are always helpful in presenting the information where you are required to share statistics and our purpose of creating this PowerPoint graphic is to make your work easier of creating the design where you have to enter information manually. Our PPT diagram gives you the access to share the story of business growth with your audience and let them know that you are there to stay for a long period. Download growth analysis bar graph for your presentation now. The best course emerges with our Growth Analysis Bar Graph For Business And Technology Flat Powerpoint Design. All alternatives are equally assessed.
People who downloaded this PowerPoint presentation also viewed the following :
Growth analysis bar graph for business and technology flat powerpoint design with all 4 slides:
Our Growth Analysis Bar Graph For Business And Technology Flat Powerpoint Design contain no boo-boos. They are combed carefully for errors.
FAQs for Growth analysis bar graph for business and technology
Key metrics for technology company growth analysis bar graphs include revenue growth, user acquisition rates, monthly recurring revenue (MRR), customer lifetime value, and market share expansion. These metrics enable stakeholders to visualize performance trends across quarterly or annual periods, with many technology firms finding that combining financial indicators with user engagement data delivers comprehensive insights into scalability, competitive positioning, and long-term viability.
Visualizing growth data through bar graphs enhances decision-making by providing immediate pattern recognition, trend identification, comparative analysis across time periods, and clear performance benchmarks that eliminate ambiguity. These visual representations enable business leaders to quickly assess market opportunities, resource allocation needs, and strategic pivots, with many executives finding that data-driven insights accelerate competitive advantage and operational efficiency.
Common pitfalls include misleading scales that exaggerate trends, inconsistent data intervals, overcrowded visuals with excessive categories, and starting y-axes at non-zero points that distort comparisons. These errors undermine credibility and decision-making accuracy, with many organizations finding that standardized formatting, clear labeling, and proportional scaling ultimately deliver more reliable insights and enhanced stakeholder trust.
Color and design elements significantly impact growth analysis bar graph effectiveness by enhancing readability, directing attention to key trends, and ensuring accessibility across diverse audiences. Strategic color choices, such as gradient schemes for progressive data or contrasting hues for comparative metrics, combined with clean typography and intuitive spacing, enable stakeholders to quickly identify performance patterns, make data-driven decisions, and communicate insights more persuasively in presentations.
Technology businesses should focus on visualizing recurring revenue growth, user acquisition and retention rates, market penetration metrics, R&D investment returns, and competitive positioning data through bar graphs. These visualizations enable companies to track subscription model performance, customer lifecycle value, and innovation pipeline effectiveness, while identifying emerging market opportunities and optimizing resource allocation for sustained competitive advantage in rapidly evolving tech landscapes.
Businesses can segment growth data by product lines, customer demographics, geographic regions, time periods, and revenue streams to reveal performance patterns and opportunities. Through strategic segmentation in bar graphs, companies identify high-performing segments, underperforming areas requiring attention, and emerging market trends, ultimately enabling more targeted resource allocation and data-driven decision making.
Historical data serves as the foundational baseline for growth trend analysis in bar graphs, enabling businesses to identify patterns, seasonal fluctuations, cyclical behaviors, and long-term trajectories across multiple time periods. This temporal context allows organizations to make informed predictions, benchmark current performance against past results, and strategic planning decisions, with many financial services and retail companies finding that historical comparisons ultimately deliver more accurate forecasting and competitive market positioning.
Businesses utilize growth analysis bar graphs to benchmark against competitors by visualizing comparative revenue trends, market share evolution, customer acquisition rates, and operational efficiency metrics across time periods. These visual comparisons enable organizations to identify performance gaps, recognize competitive advantages, and adjust strategic initiatives accordingly, with many companies finding that regular benchmarking through bar graphs accelerates decision-making and enhances competitive positioning.
Excel, Tableau, Power BI, Google Charts, and D3.js offer robust capabilities for creating professional growth analysis bar graphs, each providing customizable templates, advanced formatting options, and data integration features. These platforms enable businesses to transform complex growth metrics into compelling visual narratives through interactive dashboards, automated data updates, and export functionality, ultimately delivering clearer insights and more persuasive presentations for stakeholders.
Growth analysis bar graphs enable trend forecasting by revealing patterns in historical data, identifying growth trajectories, and highlighting seasonal variations or cyclical behaviors across different business metrics. These visualizations help organizations in sectors like retail, manufacturing, and financial services predict future performance, allocate resources strategically, and make data-driven decisions, ultimately delivering competitive advantage through enhanced planning capabilities.
Comparing multiple growth bar graphs over time reveals seasonal patterns, cyclical trends, performance correlations between different metrics, and identification of leading versus lagging indicators across business segments. These comparative analyses enable organizations to uncover hidden relationships between technology adoption and revenue growth, market expansion and customer acquisition rates, ultimately delivering strategic insights that drive more informed forecasting and resource allocation decisions.
International market growth significantly expands growth analysis scope for tech startups by introducing new revenue streams, diverse customer segments, and scalability metrics across multiple regions. These global opportunities enable startups to demonstrate accelerated user acquisition, enhanced market penetration rates, and diversified risk profiles, with many investors finding that international expansion validates scalability potential and increases valuation prospects.
B2B growth analysis bar graphs typically focus on longer sales cycles, customer lifetime value, contract renewals, and account-based metrics, while B2C graphs emphasize transaction volumes, seasonal patterns, customer acquisition costs, and retention rates. These distinct approaches reflect different business models, with B2B companies tracking fewer but higher-value relationships and B2C organizations monitoring broader consumer behaviors, ultimately delivering targeted insights for strategic decision-making.
Growth analysis bar graphs enable businesses to demonstrate clear performance trajectories, comparative advantages, and future projections through visually compelling data storytelling that resonates with investors. During presentations, companies can showcase revenue growth, market share expansion, and competitive positioning against industry benchmarks, while highlighting scalability potential and strategic milestones, ultimately delivering investor confidence and securing funding opportunities.
Businesses should prioritize data accuracy, transparent methodology disclosure, appropriate context provision, and honest representation of timeframes when presenting growth data. These ethical practices build stakeholder trust by avoiding misleading visualizations, cherry-picked metrics, and exaggerated projections, while ensuring compliance with regulatory standards, ultimately delivering sustainable credibility and long-term investor confidence.
-
Best way of representation of the topic.
-
Topic best represented with attractive design.