


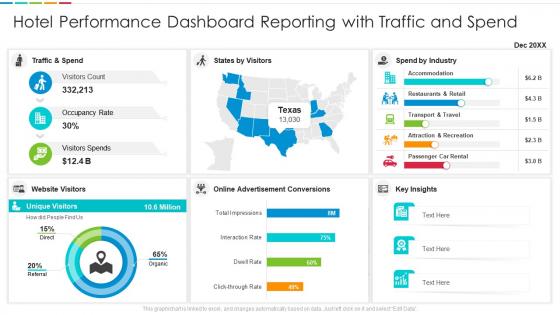
Hotel performance dashboard reporting with traffic and spend




Try Before you Buy Download Free Sample Product
 Impress Your
 Audience
 100%
100% Editable
 Save Hours
 of Time


Our Hotel Performance Dashboard Reporting With Traffic And Spend are topically designed to provide an attractive backdrop to any subject. Use them to look like a presentation pro.
People who downloaded this PowerPoint presentation also viewed the following :
Hotel performance dashboard reporting with traffic and spend with all 7 slides:
Use our Hotel Performance Dashboard Reporting With Traffic And Spend to effectively help you save your valuable time. They are readymade to fit into any presentation structure.






FAQs for Hotel performance dashboard reporting with
Honestly, start with the big four - occupancy rate, ADR, RevPAR, and guest satisfaction scores. These give you the real picture of how you're doing financially. Labor cost percentage is huge too, plus your direct booking ratio (nobody wants to pay those commission fees forever). Length of stay can be helpful depending on your property type. Oh, and if your GM is really focused on operations, throw in housekeeping efficiency and maintenance response times - guests notice that stuff immediately. I'd say pick maybe 6-7 metrics max to start. You can always add more later once you figure out what decisions you're actually trying to make.
Honestly, data viz is a game changer for hotel dashboards. You know how spreadsheets make your eyes glaze over? Charts fix that instantly. Heat maps show you which rooms aren't selling - way better than scrolling through endless rows. Seasonal trends pop out immediately with simple line graphs. Your team meetings will actually be productive for once (shocking, I know). Bar charts for revenue and occupancy are perfect starting points. Trust me, once you see everything laid out visually, you'll wonder how you ever managed without it. Makes spotting problems so much easier.
Dude, you absolutely need real-time data for hotel monitoring. When occupancy tanks or guests start complaining, you'll know instantly instead of finding out three days later when you're screwed. It's like - why would you manage a hotel using yesterday's numbers? That makes zero sense to me. Live dashboards let you jump on pricing changes, move staff around, fix problems right away. Though honestly, you don't need everything in real-time. Figure out what actually needs instant tracking versus the stuff that can wait for daily reports.
So basically these dashboards show all your important hotel numbers in one spot - ADR, occupancy, RevPAR, all that stuff. You can see patterns across different times and room types pretty easily. What's cool is it makes the obvious mistakes really jump out at you. Like if you're always booked solid but charging way too little, or dead during busy season (which honestly happens more than you'd think). The best part? You can actually fix your pricing right away instead of realizing you screwed up weeks later. Way better than just guessing what rates to set.
Honestly, guest feedback is a goldmine for understanding what's actually happening with your revenue. When housekeeping scores tank and occupancy drops at the same time? That's not a coincidence. Same goes for front desk ratings and repeat bookings - they're totally connected. Way better than staring at spreadsheets all day trying to guess what went wrong. Set up alerts when feedback dips below your comfort zone. That way you'll catch problems fast instead of finding out weeks later when someone roasts you online. Trust me, fixing issues in real-time beats damage control every single time.
Line charts are your best bet - show monthly/quarterly occupancy, ADR, and RevPAR over a few years so seasonal stuff jumps out. Heat maps work great for daily performance too. You can spot those crazy summer weekends or Christmas spikes right away. Honestly, year-over-year comparisons are clutch because they help you figure out if something's actually broken or just normal seasonal weirdness. Maybe throw in local events or weather data for context. Oh, and build your main metric views first - don't get distracted by all the bells and whistles until you've got the foundation solid.
Definitely focus on the big review platforms - Google, TripAdvisor, Booking.com. Those scores matter most. NPS is pretty crucial since it shows if people would actually tell their friends about your place. I always think complaint resolution time gets overlooked, but honestly guests hate waiting around for fixes. Track your cleanliness ratings and staff scores too. Oh, and repeat guest percentage - that's gold. Pull all this data weekly so you catch problems early. Way easier than dealing with a mess later.
Dude, automation is a game changer. No more relying on someone to remember updating spreadsheets - we both know how that goes. Your dashboard pulls from PMS and revenue systems automatically, so data flows 24/7 without gaps. Real-time updates mean you catch problems immediately instead of waiting for those weekly reports that are already outdated. Plus stakeholders actually trust the numbers when they know it's not dependent on manual work. Set up alerts too - you'll know right away if feeds break. Honestly, once you go automated you can't go back to the old way.
Put your main metrics right up front - occupancy, RevPAR, guest scores. Group similar stuff together so people aren't digging around forever. Show trends, not just random numbers sitting there. I swear, half the dashboards I see look fancy but nobody actually wants to use them daily. Add filters for dates and properties if you've got multiple locations. Oh, and definitely test it with real users first - they'll catch things you totally missed. Short sentences work. Longer ones help with flow when you're explaining the filtering options and visual layout stuff.
So basically your hotel dashboard can predict demand and pricing way ahead of time using past booking data and local events. Pretty wild how spot-on it gets. You'll also catch maintenance issues before they blow up by tracking room usage patterns. Staff scheduling becomes way easier when you know busy periods are coming. Oh and guest segments - you can actually predict who's gonna spring for the fancy stuff. I'd definitely set up alerts for major prediction changes so you're not scrambling to react later. Game changer honestly.
You know how your RevPAR might be $150 but you have no clue if that's amazing or awful? That's where benchmarks come in. They let you stack your numbers against competitors and your own past performance so you can actually tell what's working. Honestly, without them you're just guessing. Compare similar properties though - same market, same season, that stuff matters. I'd stick with maybe 3-5 solid benchmarks and track those religiously instead of getting lost in a million comparisons. Makes spotting trends way easier.
Line graphs are your best bet for tracking occupancy over time - you'll catch patterns and seasonal stuff way easier. I always throw in color zones (red under 60%, yellow 60-80%, green 80%+) so you instantly know if you're crushing it or not. Heat maps are solid for comparing different room types too. Keep it stupid simple though - executives' eyes glaze over with too much info. Date filters are a must, especially if you're juggling multiple properties. The whole point is making decisions fast without squinting at charts for ten minutes, you know?
Tableau or Power BI are gonna be your best bets here. Power BI's cheaper if you're already in the Microsoft ecosystem - that's usually what I'd lean toward. Tableau has prettier charts but honestly? The difference isn't huge for most hotel dashboards. Both connect to PMS systems and guest satisfaction tools pretty smoothly. Before you pick anything though, figure out what metrics actually matter to you first. That'll make the whole setup way easier. Oh and if you've got a tech team, building something custom with Python could work too, but that's probably overkill unless you have super specific needs.
Honestly, dashboards are game-changers for planning ahead. You'll spot seasonal patterns and figure out which revenue streams actually work. The historical data shows how your changes affected profits over time - way better than just guessing. Real-time numbers let you pivot fast when things shift (and they always do). I'd set up automated reports for your main KPIs first - saves you from constantly pulling data manually. You can even model different scenarios before spending money. It's basically like having a crystal ball, except it actually works and won't make you look crazy.
Honestly, the worst thing you can do is cram like 15 different metrics on one screen. Nobody can process that chaos. Pick 5-7 things that actually matter - RevPAR, occupancy rates, guest satisfaction. Oh and think about who's using it too, because your GM doesn't need the same stuff as front desk people. I see so many dashboards trying to update everything in real-time when half that data only changes weekly anyway. What's the point? Start simple and add more later. Also double-check your data sources first - I've watched entire presentations fall apart because someone's numbers were off.
-
Visually stunning presentation, love the content.
-
Awesomely designed templates, Easy to understand.