


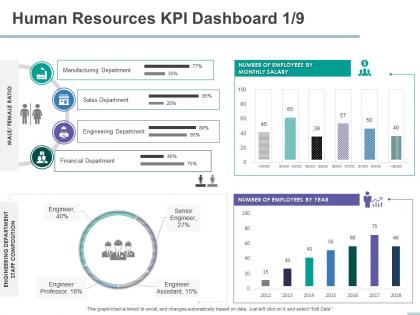
Human resources kpi dashboard financial department powerpoint presentation templates




Try Before you Buy Download Free Sample Product
 Impress Your
 Audience
 100%
100% Editable
 Save Hours
 of Time


Our Human Resources KPI Dashboard Financial Department Powerpoint Presentation Templates are topically designed to provide an attractive backdrop to any subject. Use them to look like a presentation pro.
People who downloaded this PowerPoint presentation also viewed the following :
Human resources kpi dashboard financial department powerpoint presentation templates with all 2 slides:
Use our Human Resources KPI Dashboard Financial Department Powerpoint Presentation Templates to effectively help you save your valuable time. They are readymade to fit into any presentation structure.
FAQs for Human resources kpi dashboard financial department
Start with eNPS and retention rates - those two tell you everything you need to know about whether people actually want to be there. Survey response rates are huge too. If nobody's even filling out your surveys, that's your answer right there. Also track internal mobility and absenteeism patterns. Exit interviews help when people leave, though honestly people aren't always brutally honest in those. Participation in voluntary stuff like training or company events gives you decent insight too. Don't try tracking everything though - pick 3 or 4 metrics max. You'll get a way clearer picture that way.
Check out SHRM, Deloitte, and PwC reports first - their annual benchmarking stuff is actually decent. LinkedIn HR groups are gold too, people share way more real data there than you'd expect. Honestly, just asking your network directly works best though. Most HR people will spill their metrics if you're cool about it. Just make sure you're comparing similar company sizes and industries, otherwise the numbers are useless. Skip the averages and look at 25th/75th percentiles instead. That'll show you where you actually stand. Hit up like 3-4 contacts this week.
Think of turnover rate as your company's report card. High numbers usually mean something's wrong - crappy managers, toxic culture, or people aren't getting paid enough. Nobody quits a job they actually like, you know? But super low turnover can be bad too (weird, right?). Sometimes it just means everyone's gotten too comfortable and you're not bringing in new ideas. What matters most is watching the trends and actually figuring out why people bail. Exit interviews will tell you everything - don't skip those.
Think of KPIs like warning lights on your dashboard - they tell you exactly where things are breaking down. Low customer satisfaction in one department? They probably need communication training. High turnover rates usually scream leadership problems (learned that one the hard way). The trick is connecting the dots between multiple metrics instead of just looking at one thing. Like, if productivity's down AND engagement scores suck, you've got a bigger issue than just skills. Map your worst numbers to the actual skills people need. Then boom - you know where to throw your training money.
Check your past performance first - can't set good targets without knowing your baseline. Industry benchmarks help too. Your KPIs should actually connect to business goals, not just look impressive (honestly, vanity metrics are the worst). Get your team involved since they're doing the work anyway. Big goals work better when broken into smaller chunks you can track monthly. Oh, and run a test quarter before going all-in. Saves you from realizing your targets were completely unrealistic three months later.
Oh man, you can't just look at raw HR numbers and assume they mean anything. Like 15% turnover sounds bad until you realize it's all entry-level people - totally normal there, but would be scary for senior roles. I always segment by demographics first because that's where the real story is. Maybe your overall retention looks solid, but then you discover women in leadership are bailing twice as fast as men. That's huge! Break everything down by age, gender, department - whatever makes sense for your situation. The patterns hiding in those segments are what actually matter.
So KPIs are basically like holding up a mirror to your actual company culture - not the pretty version in your head. Look at employee engagement scores and turnover rates by department first. Those internal promotion percentages? They'll tell you if people actually see a future there or if they're just stuck. Your time-to-fill metrics might reveal that your hiring process is a nightmare (happens more than you'd think). Exit interview patterns are gold too - they show whether your managers are actually good or just... there. Honestly, pick 3-4 things to track consistently instead of going crazy with spreadsheets everywhere.
Dude, get some automation tools that pull data straight from your HRIS, payroll, whatever systems you're using. No more spreadsheet nightmares. You'll see trends right away - like if people are bailing from certain departments or engagement scores tanking. The analytics side is pretty sweet too, helps you figure out what's actually causing problems instead of just staring at numbers. I swear it beats waiting around for weekly reports. Oh, and start small - pick the most annoying KPIs you're tracking manually and automate those first. Way less overwhelming.
When people don't show up, you're basically running short-staffed all the time. Productivity tanks because there's less people doing the work. Your costs go up from paying sick leave plus overtime for whoever's covering. Customers get annoyed waiting longer - honestly, who can blame them? The staff who do show up end up burnt out from picking up the slack, which just makes everything worse. I'd definitely track this stuff monthly alongside your other numbers. That way you can catch patterns before they totally mess up your performance metrics. It's one of those things that snowballs fast if you ignore it.
Figure out what actually keeps your executives awake at night - revenue, customer churn, expansion plans, whatever. Your HR metrics need to connect directly to those pain points. Growing 20% this year? Track time-to-fill for crucial roles, retention in key teams, productivity numbers. I learned this the hard way - measuring random stuff just because it's trackable gets you nowhere. Every single metric should answer "how does this move us closer to our targets?" That's literally the only question that matters when you're presenting upstairs.
Honestly, don't overcomplicate this. Time-to-fill is your bread and butter - how long jobs sit open. Then cost-per-hire and quality stuff like 90-day retention rates. Source effectiveness matters way more than people think - like, is LinkedIn actually worth it or are referrals carrying you? Also track offer acceptance rates and maybe candidate feedback from interviews. But here's the thing - pick maybe 4 metrics max that actually fit your company. I've seen teams drown in spreadsheets they never look at. Better to nail a few important ones consistently.
Retention rates basically show you how your employees actually feel about the job. Happy people don't spend their weekends updating LinkedIn, you know? When turnover spikes, there's usually something brewing - crappy managers, toxic culture, dead-end roles. You can break down the numbers by department or position to see where the bleeding's happening. Exit interviews are gold mines for this stuff, though people sometimes sugarcoat things even on their way out. If retention suddenly tanks, survey your current team too. They'll tell you what's really going on before more people bail.
Look at your engagement scores and retention rates first - that's where you'll see if people are actually on board or bailing. Communication surveys matter too since bad messaging kills most change efforts. Track training completion and how fast people get productive with new stuff. Honestly, change fatigue is brutal, so watch pulse survey participation - when that drops, people are mentally checking out. Oh, and switch to weekly tracking instead of monthly during big changes. You need that real-time data to fix problems before they turn into mass exodus situations.
So basically, tracking D&I with actual numbers beats guessing any day. You can measure stuff like who's getting promoted, pay gaps between groups, retention rates - that kind of thing. Plus inclusion survey scores if people will be honest (big if). The cool part is spotting patterns you'd miss otherwise. Like maybe you're hiring diverse talent but they're all bailing once they hit middle management. Weird flex, companies. Pick metrics that match what you're actually trying to fix, then check them regularly. Don't just set it and forget it.
So what I'd do is score the main themes on like a 1-5 scale - management quality, work-life balance, pay issues, whatever keeps coming up. Then track monthly averages. Also break down your "why people leave" percentages - maybe 40% say bad management vs 20% chasing better opportunities. Honestly, most companies are terrible at this but it's such easy data to collect! Set up some basic dashboard to check quarterly. You'll start seeing patterns that actually help you fix turnover in specific departments. Way better than just having a pile of random feedback sitting there.
No Reviews