

Information Technology Company Monthly Sales Forecast Dashboard




Try Before you Buy Download Free Sample Product
 Impress Your
 Audience
 100%
100% Editable
 Save Hours
 of Time


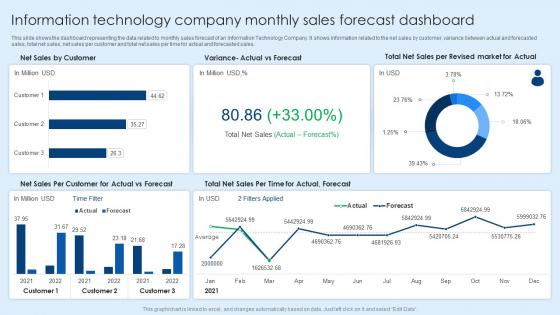
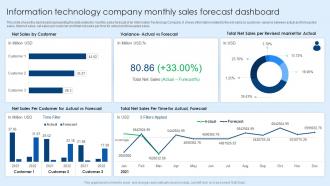
This slide shows the dashboard representing the data related to monthly sales forecast of an Information Technology Company. It shows information related to the net sales by customer, variance between actual and forecasted sales, total net sales, net sales per customer and total net sales per time for actual and forecasted sales.
People who downloaded this PowerPoint presentation also viewed the following :
Information Technology Company Monthly Sales Forecast Dashboard with all 7 slides:
Use our Information Technology Company Monthly Sales Forecast Dashboard to effectively help you save your valuable time. They are readymade to fit into any presentation structure.





FAQs for Information Technology Company Monthly
**INPUT**: What key metrics should be included in an effective sales forecast dashboard? **OUTPUT**: Effective sales forecast dashboards include pipeline velocity, conversion rates, deal probability scores, quota attainment percentages, and seasonal trend analysis. These metrics enable sales teams to identify bottlenecks, optimize resource allocation, and adjust strategies proactively, with many organizations finding that comprehensive dashboards ultimately deliver more accurate predictions and improved sales performance.
Historical sales data enhances prediction accuracy by revealing seasonal trends, customer behavior patterns, product performance cycles, and market fluctuations that inform forecasting models. By analyzing past sales across different periods, businesses can identify recurring patterns, adjust for cyclical variations, and incorporate external factors, ultimately delivering more reliable projections that enable better inventory planning and resource allocation.
Seasonality significantly impacts sales forecasting by creating predictable patterns based on holidays, weather, industry cycles, and consumer behavior throughout the year. Sales forecast dashboards can represent these seasonal trends through year-over-year comparison charts, seasonal decomposition graphs, and heat maps that highlight peak and low periods, enabling businesses to anticipate demand fluctuations and optimize inventory planning accordingly.
Visual elements like graphs and charts transform complex sales forecast data into immediately digestible insights by highlighting trends, patterns, and anomalies that raw numbers obscure. Through interactive dashboards, sales teams can quickly identify seasonal fluctuations, regional performance variations, and pipeline health indicators, while executives gain strategic oversight of revenue projections, ultimately enabling faster decision-making and more accurate forecasting across organizations.
Best practices for updating a sales forecast dashboard regularly include establishing consistent data refresh schedules, maintaining data quality through validation checks, incorporating real-time CRM integration, standardizing input formats across teams, and conducting regular accuracy reviews. These practices enhance forecasting precision by ensuring timely updates, minimizing errors, and enabling proactive adjustments, with many sales organizations finding that systematic maintenance ultimately delivers improved pipeline visibility and strategic decision-making capabilities.
Sales teams can leverage predictive analytics by analyzing historical data patterns, customer behavior trends, market conditions, and seasonal fluctuations to generate more accurate forecasts. These analytics tools streamline forecasting by identifying sales opportunities, predicting customer churn, and optimizing pipeline management, with many organizations finding that predictive insights ultimately deliver improved quota attainment and strategic resource allocation.
Effective sales forecast dashboard tools include Tableau, Power BI, Salesforce Analytics, HubSpot, and Google Data Studio, each offering robust visualization and data integration capabilities. These platforms streamline forecasting by automating data collection, enabling real-time updates, and delivering customizable reporting features, with many sales organizations finding that cloud-based solutions like Microsoft Power BI and Tableau significantly enhance forecast accuracy and team collaboration.
Collaboration between departments improves sales forecast dashboard effectiveness by integrating diverse data sources, aligning market intelligence with operational insights, and creating shared accountability for predictions. Marketing teams contribute lead quality data while operations provide capacity constraints, ultimately delivering more accurate forecasts, enhanced resource allocation, and strategic alignment across the organization.
Common pitfalls include overloading dashboards with excessive metrics, using poor data visualization choices, lacking real-time integration, ignoring mobile responsiveness, and failing to customize for different user roles. These design flaws significantly reduce dashboard effectiveness by creating confusion, delaying decision-making, and limiting accessibility, with many sales teams finding that streamlined, role-specific interfaces ultimately deliver better forecasting accuracy and user adoption.
A sales forecast dashboard helps set realistic sales targets by analyzing historical performance data, market trends, seasonal patterns, and pipeline health to provide data-driven projections. Through predictive analytics and real-time insights, sales managers can establish achievable quotas, allocate resources strategically, and adjust targets based on actual market conditions, ultimately enhancing team performance and organizational credibility.
**INPUT**: What techniques can be used to visualize variances between actual and forecasted sales? **OUTPUT**: Variance visualization techniques include waterfall charts, variance bars, heat maps, dual-axis line graphs, and bridge charts that highlight performance gaps. These methods streamline analysis by color-coding deviations, displaying percentage differences, and tracking trends over time, with many sales organizations finding that visual variance tracking enhances forecasting accuracy and accelerates decision-making processes.
Sales forecasts can be adjusted in real-time through dynamic modeling algorithms, automated data integration from CRM systems, market trend monitoring, and predictive analytics that incorporate external factors. These technologies enable organizations to recalibrate projections instantly when market disruptions occur, with many retail and financial services companies finding that real-time adjustments improve forecast accuracy by 30-40%, ultimately delivering enhanced resource allocation and competitive responsiveness.
Sales forecast dashboards aid resource allocation by providing real-time visibility into projected revenues, seasonal trends, territory performance, and pipeline health across different time horizons. These insights enable organizations to strategically allocate budgets, adjust staffing levels, optimize inventory management, and align marketing investments with predicted demand patterns, ultimately delivering more efficient resource utilization and competitive market positioning.
User feedback influences continuous improvement by identifying accuracy gaps, usability issues, and missing features that impact forecasting effectiveness. Through regular feedback collection, dashboard developers enhance data visualization, refine predictive algorithms, and add requested functionalities like drill-down capabilities or automated alerts, ultimately delivering more intuitive interfaces and precise forecasting tools that better serve sales teams' evolving needs.
Sales forecast dashboards should include role-specific metrics, customizable time horizons, territory-based filtering, pipeline stage visibility, and personalized performance indicators. Sales managers need team-wide analytics and quota tracking, while individual reps require deal-specific forecasts and activity metrics, with many organizations finding that tailored dashboard views enhance accountability and strategic decision-making across different sales functions.
-
Great templates that you can use in your next keynote or conference. They are perfect for quick and visually-engaging delivery.
-
Very unique and reliable designs.