


Key performance indicators template powerpoint slide backgrounds





Try Before you Buy Download Free Sample Product
 Impress Your
 Audience
 100%
100% Editable
 Save Hours
 of Time


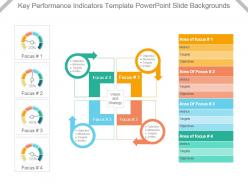
Use this creative Key Performance Indicators PowerPoint template to present the information related to performance metrics with your business associates, team or even clients. To achieve success in today’s competitive world, it is important that you should know your focus areas. With our presentation slide, you can easily highlight the business concern areas and then work towards them. Key performance indicators are ways to analyze the company performance, their departments, division and even employees. They are understandable, meaningful and measurable. Our designers have ensured to provide all the aspects in this PPT graphic. Whether you are a small business unit or a leading enterprise, you are required to assess the performance at regular intervals to achieve your goals. This PowerPoint slide makes that possible for you. You can download, edit and share the messages related to key performance indicators with any department of your organization effectively. So what are you thinking now, don’t spend much time in taking the all important decision related to your business development. Download the presentation shape and be aware of your business problem areas. To access more designs related to key performance indicators, you may visit our complete website. Our Key Performance Indicators Template Powerpoint Slide Backgrounds ensure an impeccable job. Insist on giving a flawless account of yourself.
People who downloaded this PowerPoint presentation also viewed the following :
Key performance indicators template powerpoint slide backgrounds with all 5 slides:
Be ahead of the eight ball with your thoughts. Strike through with our Key Performance Indicators Template Powerpoint Slide Backgrounds.


FAQs for Key performance indicators template
Honestly, start with task completion rates and cycle time - like how long stuff actually takes versus what you thought it would. Team utilization is huge too. Quality metrics matter because who cares if you're "productive" but just making a mess that needs fixing later? That's my biggest pet peeve with rushed projects. Employee satisfaction is worth tracking since burnt-out people don't stick around. But seriously, don't go crazy with more than 3-4 metrics or you'll be drowning in spreadsheets instead of getting work done. Pick whatever's driving you nuts right now and go from there.
Honestly, those generic KPI templates are pretty useless - you need metrics that actually fit your industry. SaaS companies should track customer acquisition cost, retail needs inventory turnover, that kind of thing. Frequency matters too. Manufacturing might check production daily while consulting firms can get away with monthly utilization tracking. I learned this the hard way when I was drowning in weekly reports nobody cared about. Focus on data your team can actually do something with. Pretty dashboards don't mean much if they're not actionable.
Honestly, Tableau and Power BI are your best bets for KPI dashboards - they handle complex stuff really well. Google Data Studio is solid too and it's free, which is nice. Excel works if you're doing basic charts, but it gets annoying fast with anything complicated. There's also Grafana if your team knows their way around tech stuff (though that might be overkill). I'd probably start with Power BI's free trial since it connects to pretty much everything. Data Studio's worth checking out too - just depends what feels right when you're actually using it.
Check them monthly if you can swing it, quarterly at the bare minimum. Seriously, don't be like my last team who set everything in January then acted shocked when nothing made sense by year-end. Monthly reviews help you spot trends before they bite you. Save the big strategy shifts for quarterly though - that's when you really dig into whether your goals still make sense. Oh, and actually put these reviews in your calendar right now. I always think I'll remember but then suddenly it's been four months and I'm scrambling to figure out what happened.
Honestly, the worst thing you can do is track like 15 different KPIs - you'll go crazy trying to analyze everything. Pick 3-5 max. And skip the vanity stuff that just makes you feel good but doesn't actually help your business (I'm talking follower counts here). Be specific too. "Better customer satisfaction" means nothing - you need actual numbers. Oh, and this seems obvious but people mess it up constantly: your KPIs should connect to making money or hitting real business goals. Review them every quarter since what matters changes. Trust me on this one.
Yeah, so most KPI dashboards play pretty well with existing BI tools. You can usually connect through APIs or just export your data from Tableau, Power BI, whatever you're using. CSV imports work fine too if you don't need real-time updates. Some let you embed charts directly - which honestly saves a ton of time. Just watch out for data format mismatches, that's where things get annoying. Oh, and make sure your refresh rates actually make sense for how often you need reports. I'd start by seeing what your current BI platform can export, then find a template that works with those options.
Dude, most people totally skip this step but you HAVE to talk to your stakeholders first. Interview the managers and executives who'll actually use these KPIs - they know what moves the needle in their departments way better than you do. Without their input, you'll create these beautiful templates that nobody gives a shit about because they don't match real business priorities. I learned this the hard way on a project last year. Get their buy-in upfront by asking about goals and pain points before you even start building anything. Trust me on this one.
Pick one qualitative thing that matters most and try quantifying it. Customer surveys can become satisfaction scores. Social media mentions turn into sentiment tracking. I do this with employee feedback too - convert it to engagement ratings. Yeah, it feels strange sometimes turning real human thoughts into numbers, but honestly it works better than you'd think. Weighted scorecards help - let those qualitative insights actually influence your KPI ratings. Just set clear criteria upfront for how you'll score everything. Start small with one area and see what happens.
Charts and graphs are your best friend here - way better than drowning them in spreadsheet hell. Skip the jargon too. Don't say "conversion rate increased 15%" when you could say "we're getting 15% more customers from website visits." I bombed my first KPI presentation because execs literally started checking their phones halfway through. Lead with impact first, then get into the weeds. Oh, and make a one-page summary with your top 3-5 metrics that actually tie to what they care about. Trust me on this one.
Honestly, just trace each KPI back to your actual goals - can't connect them? Toss it. Way too many people get caught up tracking flashy numbers that don't actually matter (guilty of this myself). Your metrics should flow upward - individual work → team goals → company priorities. That whole cascade thing actually works when done right. Leadership needs to check this alignment regularly since priorities change all the time. Look, if a KPI isn't helping you make smarter decisions about your main objectives, you're just creating busy work for yourself.
So leading KPIs are like your car's speedometer - they show where you're headed. Lagging ones? More like the odometer, tracking what already happened. Revenue and customer churn are lagging. Sales pipeline and training hours are leading indicators. You'll want about 70% leading, 30% lagging on your dashboard. Leading metrics let you fix stuff before it tanks your results, but honestly, lagging ones prove if your changes actually worked. Start with your main lagging metrics first. Then figure out what leading indicators drive those numbers - work backwards from there.
KPI templates are honestly a game-changer for spotting trends. You're basically organizing your data the same way every month, which makes patterns super obvious. Without that consistency, important trends just get buried in messy spreadsheets - been there! The historical data becomes really valuable for forecasting too. Like, you can actually say "based on these last six months, we'll probably hit X by December" instead of just guessing. Even if you don't see clear trends right away, start tracking consistently now. Trust me on this one.
You really need those industry benchmarks to know if your KPIs make any sense. Without them, you're just throwing numbers around blindly - either setting the bar way too low or creating impossible targets that'll crush your team's morale. Look at 3-4 competitors or grab some industry reports to see what "good" actually means in your space. Plus stakeholders love hearing "here's how we stack up against the competition" - makes everything feel more legit. I learned this the hard way when I set goals that were completely disconnected from reality. Trust me, do the homework upfront.
So basically, you need super specific KPIs or people will just make excuses later. Like instead of "improve customer satisfaction" - which means nothing honestly - say "hit 85% CSAT by Q3." Big difference. Assign one person to own each metric too. When everyone knows exactly what they're responsible for and by when, there's nowhere to hide when review time comes. I've watched teams fall apart because their goals were too wishy-washy. You want zero wiggle room for interpretation. That's how you actually get results instead of just endless meetings about why things didn't work out.
Honestly, skip the boring presentations and do hands-on workshops instead. Have them actually build KPIs for their own jobs - way more engaging. I'd start by explaining how metrics connect to their daily tasks, not some vague company goals. Real company data works best for practice sessions. Oh, and those role-playing things where teams present to each other? Super helpful. Monthly check-ins afterward are crucial - people forget stuff otherwise. The whole point is making it feel relevant to what they're actually doing every day, not just theoretical nonsense.
-
Colors used are bright and distinctive.
-
Great experience, I would definitely use your services further.