

KPI Dashboard For Service Level Agreement Report





Try Before you Buy Download Free Sample Product
 Impress Your
Audience
 100%
Editable
 Save Hours
of Time


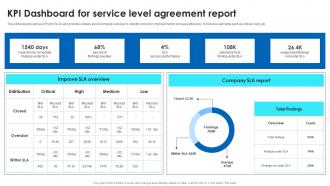
This slide depicts various KPIs for SLAs and provides details about company overview to identify errors for improvement to increase efficiency. It includes elements such as critical, high, etc.
People who downloaded this PowerPoint presentation also viewed the following :
KPI Dashboard For Service Level Agreement Report with all 10 slides:
Use our KPI Dashboard For Service Level Agreement Report to effectively help you save your valuable time. They are readymade to fit into any presentation structure.








FAQs for KPI Dashboard For Service
Pick your top 3-5 KPIs first - everything else is just noise. Real-time data beats pretty charts every time, and make sure you can actually dig into the details when numbers look weird. I've worked with teams that had these gorgeous dashboards that told them absolutely nothing useful, which is honestly worse than having no dashboard at all. Your CEO doesn't need the same view as your marketing folks, so build different versions. Focus on metrics that actually move the needle, not vanity numbers that just make you feel good. Simple beats fancy.
Okay so colors are huge for dashboards - red for problems, green for good stuff, you know? People get it instantly. White space is your friend too, otherwise it looks like a hot mess. I learned this the hard way when my first dashboard looked like a rainbow exploded on it lol. Keep your fonts consistent so there's actual hierarchy. Simple icons work best. Short sentences help. The whole point is making data easy to scan without thinking too hard about it. Trust me, users will thank you when they can spot issues in like 2 seconds instead of hunting around.
Honestly, you can pull from basically anything - your CRM, Google Analytics, spreadsheets, social platforms, Salesforce, whatever. Most dashboard tools already have connectors built in, which is clutch because nobody wants to do manual exports forever. Multiple sources work fine too, actually better since you get the full picture. Just double-check that your data updates often enough to matter. Oh, and start with wherever your most important metrics live - that's usually the easiest win.
Look, it really depends on how fast your data changes and when your team actually makes decisions. Most operational stuff like sales numbers? Daily updates work great. Strategic KPIs though - weekly or monthly is totally fine. I've honestly seen people set up hourly dashboard refreshes when nobody checks them more than once a day (seems like overkill to me). Match your refresh schedule to when decisions actually happen. Weekly team reviews mean weekly updates are probably enough. Start with whatever feels right for your workflow, then tweak it based on how people actually use the thing.
Revenue, profit margins, cash flow, and burn rate are the big four you'll see everywhere. AR/AP aging, customer acquisition cost, and lifetime value are pretty standard too. Honestly though? Most dashboards I've looked at are way too cluttered with random metrics nobody actually uses. Pick 5-7 things your leadership team genuinely cares about and acts on. If you're SaaS, monthly recurring revenue is critical. Retail companies obsess over inventory turnover instead. Don't overthink it - start with what drives real decisions at your company, then add more later if you need to.
Honestly, just figure out what actually matters in your industry first. Retail? Track conversion rates, inventory turnover, customer acquisition costs. Healthcare focuses more on patient outcomes and wait times. Manufacturing cares about equipment efficiency and defect rates - stuff like that. Don't just steal someone else's setup though, it won't work for you. Ask your team what metrics actually stress them out, then build around those answers. I learned this the hard way when I copied a template once. Total waste of time. Your dashboard should solve real problems, not look pretty.
So here's the thing - real-time data is what separates actual useful dashboards from those fancy ones that just sit there looking nice. You can catch problems the second they happen instead of finding out hours later when everything's already on fire. Picture this: your site goes down and you find out immediately vs. discovering it three hours later from angry customer emails. Totally different damage control situation, right? Without live updates, you're basically making decisions based on old info. Set up alerts for your biggest KPIs though - you don't want to be glued to the screen all day.
Start with clean data sources and validation rules at entry - that's your base. You'll want clear governance policies so everyone knows who owns what data and formatting standards. Honestly, I've seen way too many dashboards with stale metrics nobody questioned for months, so regular audits are key. Set up automated alerts for weird patterns or missing values. Cross-reference your KPIs with source systems periodically too. Oh and assign data stewards for each metric - someone needs to be accountable when numbers look sketchy. Trust me, having that person makes all the difference.
Pick metrics that actually connect to what you're trying to achieve - not just the standard stuff everyone tracks. Keep your dashboard to 5-7 max because honestly, more than that and nobody pays attention. Focus on numbers you can actually do something about, otherwise you're just stressing yourself out for no reason. Leading indicators are way better than lagging ones since they show you what's coming instead of what already went down. Oh, and definitely ask the people who'll use this thing what they actually want to see. They know better than anyone what helps them make real decisions. Short sentences work. Longer ones give you room to breathe and explain the why behind your choices.
Think of user roles like security guards for your dashboard - they control what you can actually see. Sales managers get revenue stuff and team numbers, but finance data? Nope, that's locked away. Marketing people see their campaign metrics but HR info stays off-limits. Pretty straightforward need-to-know setup. Your role automatically shows or hides different widgets and reports. I've seen people get confused when they can't find certain data they swear should be there. If something's missing that you think you should have access to, just bug your admin about it.
Honestly, cramming too many KPIs into one dashboard just confuses everyone. People get overwhelmed and can't figure out what actually needs their attention. I've seen dashboards with like 20 tiny charts - nobody's got time to decode all that mess. You end up missing the important stuff because it's buried under random metrics that probably don't even matter. Keep it simple, maybe 5-7 key things max. Your users will thank you for it. If you need more detail, just build separate dashboards for different teams instead of trying to make one monster dashboard work for everyone.
Line charts are perfect for this - they'll show your data movement super clearly. Throw in some trend arrows too. I'd set up month-over-month and year-over-year comparisons right on the dashboard so people don't have to dig around. Sparklines are actually pretty cool since they give you those mini trend snapshots without hogging space. Color coding is clutch - green for good trends, red for declining stuff. Oh, and make sure you're showing like 12-24 months of data minimum. That way people can catch seasonal patterns and longer shifts. Just keep your time intervals consistent.
So for KPI dashboards, there's a bunch of good options. Tableau and Power BI are the big names - crazy powerful but they'll hit your wallet hard. Google Data Studio is free and works pretty well for most things, though it can be annoying sometimes. Klipfolio and Geckoboard are way more user-friendly if that matters to you. Honestly, don't sleep on Excel or Google Sheets for basic tracking - they're better than you'd think. I'd probably mess around with Google Data Studio first since it's free, then see if you need anything fancier later.
First thing - check if people are actually logging in regularly and how long they're spending on it. Which metrics do they click on most? That tells you what matters to them. Survey users about whether it's actually changing how they make decisions (this part can be tricky to get honest answers on). Response time to problems is probably the biggest win - are teams spotting issues way faster now? Track complaints about data being wrong too. Nobody wants to base decisions on garbage data. Do quarterly check-ins against your original goals. Start with usage stats though - they're super easy to pull and you'll know right away if people care about it or not.
Honestly, get your stakeholders involved in picking the KPIs from the start - people only care about metrics they helped choose. Clean visuals are huge too. Nobody's checking a dashboard that takes forever to load (learned this the hard way). Set up alerts for the important stuff so they're not constantly monitoring. Oh, and those review meetings? Focus on what the data actually means, not just rattling off numbers. The key thing is connecting everything back to decisions they make daily. Otherwise you'll have beautiful dashboards that nobody uses.
-
One word for SlideTeam–Versatile!
-
“I've always gotten excellent slides from them and the customer service is up to the mark.”