


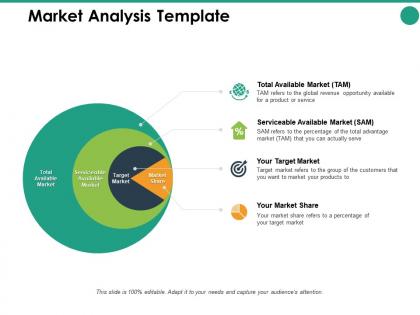
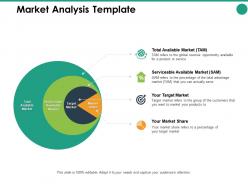
Market analysis template serviceable ppt powerpoint presentation pictures format




Try Before you Buy Download Free Sample Product
 Impress Your
 Audience
 100%
100% Editable
 Save Hours
 of Time


Empower folks to battle despair with our Market Analysis Template Serviceable Ppt Powerpoint Presentation Pictures Format. You will be their dashing hero.
People who downloaded this PowerPoint presentation also viewed the following :
Market analysis template serviceable ppt powerpoint presentation pictures format with all 5 slides:
Dash ahead with our Market Analysis Template Serviceable Ppt Powerpoint Presentation Pictures Format. Acquire the energy to accelerate away.

FAQs for Market analysis template serviceable ppt powerpoint
Definitely cover market size, growth trends, and who your competitors are. Customer demographics matter too. I'd add a SWOT analysis - stakeholders eat that stuff up for some reason. Oh, and pricing analysis is clutch if it fits your industry. Regulatory stuff too, depending on what you're dealing with. Here's what works: put your executive summary up top with bullet points hitting the big insights. Make sure your charts and graphs tell the story even if people don't read everything (let's be real, half won't). Build yourself a good template so you can just swap out sections for future projects.
Dude, charts and graphs are a game-changer for market analysis. Nobody wants to stare at endless spreadsheets - I literally fall asleep looking at those things. When you turn that data into visuals, trends just pop out at you. Market share shifts, customer patterns, all that stuff becomes obvious instantly. Your stakeholders will actually pay attention instead of checking their phones. Plus people remember visual stuff way better than boring text blocks. Start with simple bar charts or pie graphs - nothing fancy needed. Honestly, even basic visuals make your data way more compelling than walls of numbers.
Honestly, the worst thing you can do is make it too generic - you'll get meaningless fluff that doesn't help anyone decide anything. I've literally seen 20-page monsters that just collect dust. Start with maybe 3-4 sections that actually connect to real business decisions your team makes. Don't pack in every metric you can think of either. Focus on what your stakeholders genuinely need to know. Oh, and don't just rely on old data - factor in market changes and competitive stuff beyond your obvious rivals. You can always add more sections later once people are actually using the thing consistently.
Definitely swap out the industry stuff that actually matters for your market. Tech companies should focus hard on user acquisition costs and churn - retail needs inventory turnover and foot traffic instead. Healthcare has tons of regulatory requirements, but software barely touches that stuff. Core structure stays the same (market size, competition, trends), but you gotta customize the KPIs and data sources. I've watched people burn weeks on generic templates that don't match their industry at all - such a waste. Figure out the 3-5 metrics that actually drive decisions in your space first, then build everything around those.
Honestly, stick with government stuff like Census Bureau and Bureau of Labor Statistics - that's your gold standard. IBISWorld and Forrester do solid industry reports too. Trade associations are actually amazing for this, they publish super niche data you won't find anywhere else. Skip the random blog posts though, they're just recycling old info. Oh and if you can get actual data from your target customers, that's obviously the holy grail. Focus on 2-3 rock-solid sources instead of going crazy collecting everything. Quality beats quantity here.
Honestly, quarterly is the bare minimum - but it really varies by industry. Tech companies should probably do it monthly since everything changes so fast. Real estate? You could get away with twice a year. Watch for big shifts like new competitors popping up, regulatory changes, or when your customers start acting weird. Also refresh it whenever you're launching something new or going after a different market. I learned this the hard way when I waited too long and missed some obvious trends. Just set a reminder and actually stick to it - dead data makes for useless templates.
Look, competitor analysis is basically business stalking - and it's super important for figuring out where you actually fit in the market. Map out your top 5-7 direct competitors first. Check their pricing, market share, what makes them different. Customer reviews are goldmines too. This stuff helps you spot gaps and opportunities without accidentally picking fights with the big players. I spent way too much time on this when I first started, but honestly? It's worth building those detailed profiles of their strengths and weaknesses upfront.
So I'd start with a pie chart showing how big each segment is, then do a detailed table breaking down the key stuff for each group. Demographics are obvious but psychographic data is gold if you can get it. Pain points, buying habits, where they hang out - all that matters. Short sentences work too. Honestly, the biggest mistake I see is people creating segments they can't actually reach or track. Like, cool chart bro but can you even market to these people? Focus on segments that actually translate into actionable strategy.
Honestly, start with market size trends and growth rates - they're your bread and butter for seeing what's coming. Customer acquisition patterns matter too, plus competitive market share shifts. Pricing trends are huge but people sleep on them. Revenue per customer is where you can really spot if things are heating up or cooling down, which is honestly more useful than most realize. If your market has seasonal stuff, track that too - learned that one the hard way last year. Those five will get you ahead of the curve before everyone else catches on.
User feedback is honestly everything when it comes to making templates that people actually want to use. People will straight up tell you when sections don't make sense or when you're missing stuff they need. Then you can fix the layout, add better headers, whatever. I've seen so many templates that look great on paper but totally flop because nobody asked users what they actually wanted. You'll figure out which metrics different teams care about most and can put those front and center. It's this whole back-and-forth thing that helps you find the sweet spot between being thorough but not overwhelming. Just survey a few people about what's bugging them before you do your next update.
Honestly, I'd start with whatever you already have - Excel or Google Sheets work great for most market analysis stuff. Tableau and Power BI are amazing if you need fancy visuals, though they can be overkill sometimes. Google Data Studio is free and pretty decent too. If you want something that feels more modern, check out Airtable or Notion - they're good at pulling real-time data automatically. I got a bit obsessed with Notion last year, it's weirdly addictive once you get into it. The main thing is finding tools that actually connect to your data sources without being a pain. Don't overthink it - build with what you've got first.
Lead with your biggest findings right away - don't make people wade through your methodology first. I'd do a quick exec summary with your 3-4 key insights and what they actually mean for business decisions. Visuals are your friend here because honestly, walls of text just get skipped. Structure everything around the choices they need to make, not just data you found. Focus on "so what does this mean" and "what do we do now" instead of just reporting numbers. Oh, and don't forget concrete next steps with actual owners and deadlines. Your analysis won't matter if nobody can act on it.
Honestly, data privacy should be your first concern - don't grab personal info without asking. Be upfront about where your data comes from too. The bias thing is huge though. I've watched so many templates completely whiff on entire market segments because someone baked in their assumptions from day one. Really annoying when it happens. Get different voices involved in your research approach and think about how your results might hit various communities differently. Oh, and set up regular check-ins to spot your blind spots. You'll definitely have them - we all do.
So basically you use the template to dig into what customers actually want vs what's out there right now - that gap is pure gold. I always dive into customer pain points first because honestly, that section tells you everything. Then check out where competitors are weak and what trends are shifting demand. Document all your findings and rank opportunities by market size plus what your company can actually pull off. Oh and start with customer needs analysis - I probably should've mentioned that first but whatever. The whole thing just makes spotting product opportunities way more systematic than just winging it.
You need to get really specific with your audience - like "working moms 30-45 who buy organic" instead of just "women shoppers." Look at demographics (age, income, where they live) plus the deeper stuff like their values and what problems they're dealing with. Their buying habits matter too - are they loyal to brands or always switching? Figure out where they actually spend time online because that's obviously where you'll find them. Honestly, the best thing is creating 2-3 fake personas with names and backstories. Sounds weird but it works way better than some vague description. Oh, and don't forget what influences their decisions - friends, reviews, whatever.
No Reviews