

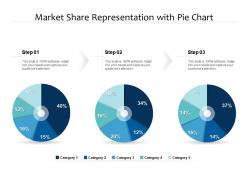
Market share representation with pie chart





Try Before you Buy Download Free Sample Product
 Impress Your
 Audience
 100%
100% Editable
 Save Hours
 of Time


Our Market Share Representation With Pie Chart are explicit and effective. They combine clarity and concise expression.
People who downloaded this PowerPoint presentation also viewed the following :
Market share representation with pie chart with all 2 slides:
Give your audience a fulfilling experience. They will find our Market Share Representation With Pie Chart elevating.
FAQs for Market share representation
Key components influencing market share include product quality, pricing strategies, brand recognition, distribution channels, customer service excellence, and innovation capabilities. These factors work synergistically across industries, with technology companies leveraging innovation and competitive pricing, while retail businesses focus on distribution reach and customer experiences, ultimately delivering sustainable competitive advantages and revenue growth.
Visual representation of market share through pie charts enhances audience understanding by providing immediate proportional comparisons, simplifying complex data relationships, and enabling quick identification of market leaders and gaps. This approach streamlines data interpretation for stakeholders, with many financial services firms and retail analysts finding that visual formats accelerate decision-making processes and improve strategic discussions during presentations.
Common pitfalls include using too many small segments, inconsistent data sources, misleading color schemes, unclear labeling, and omitting the "others" category for minor competitors. These visualization errors confuse stakeholders by cluttering the chart, misrepresenting competitive positioning, and obscuring market insights, with many organizations finding that simplified, accurately-labeled charts deliver clearer strategic understanding and better decision-making outcomes.
Color choices in pie charts significantly influence audience perception by creating visual hierarchy, emotional associations, and interpretation biases that can emphasize or diminish specific market segments. Strategic color selection helps viewers quickly identify market leaders through bold, attention-grabbing hues while neutral tones minimize less favorable data, with many organizations finding that warm colors suggest growth and dominance whereas cool colors imply stability or smaller presence.
Larger pie segments immediately signal market dominance and competitive strength, while smaller segments suggest emerging players or niche positions, with viewers instinctively associating size with success and stability. This visual hierarchy influences strategic decisions across industries, as stakeholders in retail, technology, and financial services use segment proportions to assess market opportunities, competitive threats, and investment priorities, ultimately driving resource allocation and business positioning strategies.
Businesses can effectively use market share pie charts by clearly labeling competitor segments, highlighting their own position with distinct colors, and including percentage values for immediate comprehension. These visualizations enable strategic discussions about competitive positioning, market opportunities, and growth targets, with many organizations finding that pie charts simplify complex market dynamics for executive decision-making and investor presentations.
**INPUT**: What data sources are most reliable for determining accurate market share figures? **OUTPUT**: Reliable market share data sources include industry reports from research firms like Gartner and IDC, government statistical databases, trade association publications, company financial filings, and syndicated research services. These sources enhance accuracy by combining multiple methodologies, cross-referencing datasets, and providing sector-specific insights, with many organizations finding that strategic combinations deliver comprehensive market intelligence. [Word count: 58 words]
Market share pie charts can be culturally adapted through strategic color selection, directional orientation, symbolic integration, localized labeling, and culturally-appropriate visual hierarchies. Organizations operating across diverse markets enhance communication effectiveness by incorporating regional color meanings, right-to-left reading patterns where relevant, and familiar iconography, ultimately delivering more resonant presentations and stronger stakeholder engagement globally.
3D pie charts offer enhanced visual appeal and depth perception that can make data more engaging for audiences, while also creating a sense of sophistication and professionalism in presentations. However, many organizations find that 2D charts deliver better accuracy and clarity for data interpretation, with 3D effects sometimes distorting proportional relationships, ultimately requiring strategic consideration of audience needs versus analytical precision.
Market share pie charts integrate seamlessly with bar charts for historical comparisons, line graphs for trend analysis, geographic heat maps for regional insights, and dashboard widgets for real-time monitoring. This strategic combination enables organizations across retail, technology, and financial services to visualize competitive positioning comprehensively, track market evolution dynamically, and make data-driven strategic decisions that enhance competitive advantage.
The legend identifies each pie segment by connecting colors or patterns to specific categories, serving as the visual decoder that makes data interpretation possible, accurate, and accessible to viewers. It should be positioned strategically near the chart, use clear and concise labels, maintain consistent formatting, and employ sufficient color contrast, with many organizations finding that well-designed legends significantly enhance comprehension and reduce misinterpretation across diverse audiences.
Market share pie charts should be updated quarterly or biannually using real-time data sources, competitive intelligence, and industry reports to capture shifting consumer preferences, emerging competitors, and seasonal fluctuations. Regular updates enable businesses to track their competitive positioning, identify growth opportunities, and adjust strategic initiatives accordingly, with many organizations finding that dynamic visualization tools streamline this process while delivering actionable insights for market planning.
Interactive pie charts enhance engagement by allowing real-time data exploration, clickable segments for detailed breakdowns, dynamic filtering options, and animated transitions between different data views. These features transform static presentations into collaborative experiences, with many sales teams and consultants finding that audiences retain information better and participate more actively, ultimately delivering stronger presentation outcomes and improved stakeholder buy-in.
Pie charts emerged in early 19th-century statistical visualization and gained prominence in market analysis during the mid-20th century as businesses sought clearer ways to represent market share distribution. These visual tools revolutionized competitive analysis by enabling companies to quickly assess their position relative to competitors, identify market leaders, and communicate strategic insights to stakeholders, with many organizations finding that pie charts streamline decision-making processes.
Market share data influences business decisions by identifying growth opportunities, revealing competitor vulnerabilities, and guiding resource allocation across product lines and markets. Through comprehensive analysis, organizations streamline strategic planning, enhance competitive positioning, and optimize marketing investments, with many companies finding that regular market share monitoring ultimately delivers faster response times to market shifts and sustainable competitive advantage.
No Reviews