


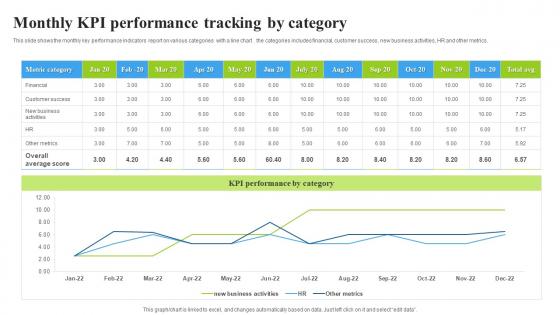
Monthly KPI Performance Tracking By Category




Try Before you Buy Download Free Sample Product
 Impress Your
 Audience
 100%
100% Editable
 Save Hours
 of Time


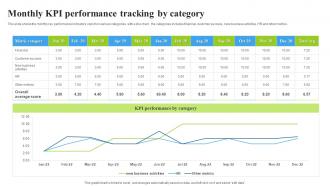
This slide shows the monthly key performance indicators report on various categories with a line chart. the categories includes financial, customer success, new business activities, HR and other metrics.
People who downloaded this PowerPoint presentation also viewed the following :
Monthly KPI Performance Tracking By Category with all 7 slides:
Use our Monthly KPI Performance Tracking By Category to effectively help you save your valuable time. They are readymade to fit into any presentation structure.





FAQs for Monthly KPI Performance
Effective organizational KPIs include revenue growth rate, customer acquisition cost, employee productivity metrics, operational efficiency ratios, and customer satisfaction scores. These metrics work together by providing comprehensive performance visibility across financial, operational, and human capital dimensions, with many organizations finding that strategic KPI alignment enables data-driven decision making and sustainable competitive advantage.
KPI tracking aligns with business objectives by establishing clear performance metrics that directly measure progress toward strategic goals, creating accountability frameworks, and enabling data-driven decision making. This strategic approach helps organizations monitor operational efficiency, track revenue targets, and assess customer satisfaction, with many companies finding that aligned KPIs ultimately deliver enhanced performance visibility and competitive advantage.
Real-time KPI tracking tools include business intelligence platforms like Tableau and Power BI, dashboard solutions such as Klipfolio and Geckoboard, and comprehensive analytics suites like Google Analytics and HubSpot. These technologies streamline performance monitoring by automating data collection, providing instant visualizations, and enabling immediate decision-making, with many organizations finding that real-time insights significantly enhance operational efficiency and competitive responsiveness.
KPI review frequency depends on business velocity and strategic goals, with operational KPIs tracked daily or weekly, tactical metrics reviewed monthly or quarterly, and strategic indicators assessed quarterly or annually. Many organizations find that combining real-time dashboards for critical metrics with structured quarterly reviews enables responsive decision-making while maintaining strategic focus, ultimately delivering both agility and long-term alignment.
Data visualization transforms KPI tracking by converting complex metrics into clear charts, graphs, dashboards, and heat maps that enable rapid comprehension and decision-making. Through interactive dashboards and real-time visual displays, organizations streamline performance monitoring, identify trends immediately, and communicate insights effectively across teams, ultimately delivering enhanced operational efficiency and faster strategic responses.
Common pitfalls include setting too many KPIs, choosing metrics that don't align with strategic goals, focusing on vanity metrics over actionable insights, and failing to establish realistic benchmarks. These challenges can derail performance measurement across organizations, with many companies finding that prioritizing 3-5 meaningful KPIs rather than tracking dozens ultimately delivers clearer focus and better business outcomes.
Businesses ensure actionable KPI tracking by establishing clear benchmarks, linking metrics to specific outcomes, and implementing regular review cycles with defined response protocols. Through automated dashboards and milestone-based reporting, organizations in retail, healthcare, and financial services streamline decision-making processes, reduce response times, and ultimately deliver measurable improvements in operational efficiency and competitive positioning.
Employee performance KPIs include productivity metrics, quality scores, goal achievement rates, customer satisfaction ratings, and attendance records. These measurements enable managers to assess individual contributions, identify development opportunities, and align personal objectives with organizational goals, with many companies finding that balanced scorecards combining quantitative and qualitative metrics deliver comprehensive insights into workforce effectiveness.
KPI tracking enhances decision-making processes by providing real-time data visibility, identifying performance trends, and enabling evidence-based strategic choices. Through comprehensive dashboards and analytics, organizations streamline resource allocation, minimize operational inefficiencies, and accelerate response times to market changes, with many businesses finding that data-driven decisions ultimately deliver measurable competitive advantage.
SMART criteria ensure KPIs are Specific, Measurable, Achievable, Relevant, and Time-bound, creating clear performance benchmarks that drive accountability and strategic focus. This framework enables organizations to track meaningful progress, allocate resources effectively, and make data-driven decisions, with many companies finding that well-defined KPIs ultimately deliver improved operational efficiency and competitive advantage.
Organizations effectively communicate KPI results through visual dashboards, executive summaries, regular reporting cycles, stakeholder-specific presentations, and automated alerts for critical metrics. These approaches streamline transparency by tailoring information depth to audience needs, highlighting actionable insights, and maintaining consistent communication rhythms, ultimately enabling faster decision-making and stronger stakeholder alignment across all organizational levels.
Benchmarking KPIs against industry standards provides competitive positioning insights, performance gap identification, strategic goal setting, and validation of improvement initiatives. Through comparative analysis, organizations can identify underperforming areas, set realistic targets, and prioritize resource allocation, with many companies finding that industry benchmarking ultimately delivers enhanced operational efficiency and sustainable competitive advantage.
KPI tracking integrates into daily operations through automated dashboards, real-time data feeds, mobile monitoring apps, regular team check-ins, and embedded performance metrics within existing workflows. This strategic combination enables managers to make immediate adjustments, identify trends quickly, and maintain operational efficiency, with many organizations finding that seamless integration ultimately delivers improved accountability and faster decision-making across all departments.
Maintaining employee engagement with KPIs requires clear communication of how individual metrics connect to organizational goals, regular feedback sessions, and involving employees in KPI selection processes. Through transparent dashboards, recognition programs, and collaborative goal-setting, organizations create ownership and accountability, with many companies finding that linking KPIs to professional development opportunities significantly enhances motivation and performance outcomes.
Technology revolutionizes KPI tracking by automating data collection, providing real-time dashboards, and enabling predictive analytics through AI and machine learning algorithms. These digital solutions streamline reporting processes, minimize manual errors, and deliver instant insights across departments, with many organizations finding that automated systems enhance decision-making speed and strategic responsiveness.
-
Excellent Designs.
-
Topic best represented with attractive design.