


Monthly Sales Review Powerpoint PPT Template Bundles





Try Before you Buy Download Free Sample Product
 Impress Your
Audience
 100%
Editable
 Save Hours
of Time


Our Monthly Sales Review Powerpoint PPT Template Bundles are topically designed to provide an attractive backdrop to any subject. Use them to look like a presentation pro.
People who downloaded this PowerPoint presentation also viewed the following :
Monthly Sales Review Powerpoint PPT Template Bundles with all 18 slides:
Use our Monthly Sales Review Powerpoint PPT Template Bundles to effectively help you save your valuable time. They are readymade to fit into any presentation structure.
-

Monthly Sales Review
-
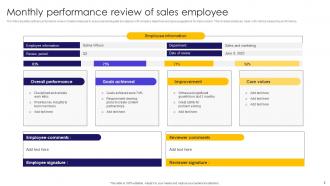
Monthly performance review of sales employee
-
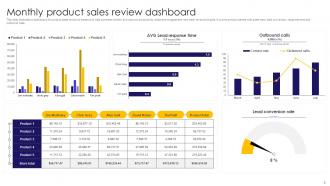
Monthly product sales review dashboard
-
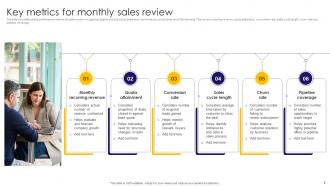
Key metrics for monthly sales review
-
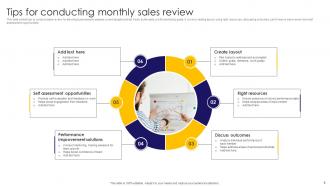
Tips for conducting monthly sales review
-
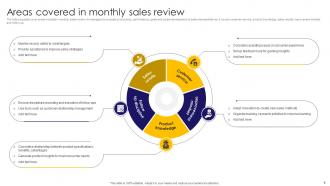
Areas covered in monthly sales review
-
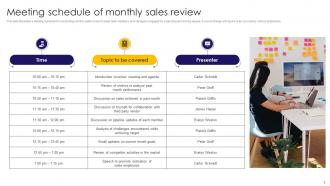
Meeting schedule of monthly sales review
-

Methods for conducting monthly reviews of sales representatives
-
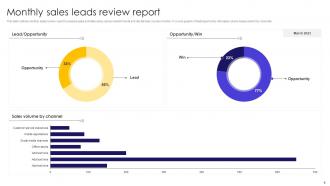
Monthly sales leads review report
-
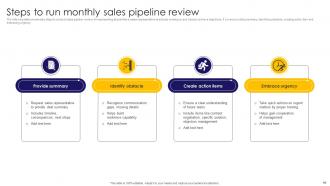
Steps to run monthly sales pipeline review
-
Monthly sales team review icon
-
Monthly sales growth review icon
-

Thanks for watching
-

-

-

-

-

FAQs for Monthly Sales Review Powerpoint
Start with the big stuff - total revenue, units sold, conversion rates versus last month and your yearly goal. Average deal size is clutch too since it shows if you're landing bigger fish or smaller ones. Then slice it by product, sales rep, and where leads come from. Pipeline health matters just as much: new leads, deals cooking, close rates. Honestly, I'd rather see fewer metrics done well than a ton of surface-level stuff. Wrap up with 2-3 concrete things you'll actually do next month based on what the data's telling you.
Dude, charts and graphs are a game changer for sales presentations. People absorb visual stuff way quicker than boring spreadsheet data - like, our brains are wired that way. Nobody wants to sit through someone reading off percentages, you know? A simple line chart shows growth patterns and dips instantly. Heat maps are pretty cool too for highlighting problem areas. Oh, and use different colors for your big wins - makes everything pop. Honestly, I've seen people zone out completely when there's just text and numbers. Visuals actually stick in memory longer, so your team will remember the important stuff.
Lead with the big three: revenue, pipeline, conversion rates. But here's the thing - don't just rattle off numbers like you're reading a grocery list. Look for patterns instead of obsessing over individual deals. Compare against your actual goals, not just last month's performance (honestly, month-to-month comparisons can be pretty misleading). Talk through what your team crushed and where they struggled. Any market weirdness affecting things? Good to mention. Always wrap up with 2-3 concrete next steps, or you'll walk away with nothing but a bunch of forgotten data points.
Side-by-side charts are your best friend for this stuff. Show the same metrics (revenue, units sold, conversion rates) for both periods using matching colors and scales. Bar charts work really well too - honestly way better than those nightmare spreadsheets that put people to sleep. Highlight the big differences with callout boxes or arrows. I'd throw the percentage changes right on each slide so people don't have to do math. The whole point is making it brain-dead simple to spot what's changed. Line graphs can work if they're not too cluttered, but keep it clean.
Honestly, turning your sales reviews into stories is a game-changer. Nobody wants to sit through another slide saying "Q3 dropped 15%" - boring! Walk them through what actually happened instead. What were customers saying? Which competitors stole deals? Paint the whole picture like you're explaining drama to a friend. People remember stories way better than numbers on a spreadsheet anyway. I learned this the hard way after watching too many executives zone out during data presentations. Structure each point like a mini-story: here's what went down, here's the problem we hit, here's how it played out.
Ugh, the worst thing you can do is just dump a bunch of numbers on people without explaining what they actually mean. I've sat through way too many presentations like that. Don't cherry-pick only the wins either - own up to the problems first, then explain how you'll fix them. Compare everything to your targets and last quarter's numbers, not just random figures. Skip the vanity metrics that look impressive but don't help anyone make real decisions. What really matters? Focus on insights people can act on. Oh, and always end with concrete next steps - otherwise you're just wasting everyone's time.
Honestly, dig into your last 3-6 months of sales data first - that's your real baseline, not some random number someone pulled out of thin air. Check which products or team members are crushing it versus struggling. Seasonal stuff matters too, like if Q2 was 15% stronger than Q1, you can probably push Q3 targets higher. Factor in your actual conversion rates and how fast deals move through your pipeline. Most people just wing it with targets which is kinda pointless. Set stretch goals that'll push your team but won't make them want to quit. Short version: use real performance trends, not wishful thinking.
For sales stuff, dashboard templates are your best bet. Show multiple metrics without making people's eyes glaze over. Stick with simple bar charts and line graphs - honestly, those fancy infographics just confuse everyone in meetings. You'll want clear sections for revenue trends, conversion rates, and pipeline health. Side-by-side comparisons of actual vs. target numbers are clutch. The whole thing should be scannable so people can quickly spot what's working and what's not. Start basic, then tweak it based on whatever questions your team keeps asking over and over.
Here's what I'd do - set up a section in your monthly review that connects feedback themes to actual sales numbers. Grab quotes from surveys and support tickets, then group them by common complaints or wins. So if people are griping about pricing and your conversions tanked that month, boom - there's your answer. I'm a big fan of throwing together a simple chart that shows feedback sentiment next to revenue trends. Makes it super obvious when there's a connection. The visual thing really works because nobody wants to dig through paragraphs of data to find patterns, you know?
Hey! So for your presentation, start with your biggest winner right up front - gets everyone hooked. Bold colors and bigger charts will make those top performers stand out. I'd do a simple ranking table first, then tell the story behind each product with before/after numbers. Bar charts are your friend here (pie charts are kinda meh tbh). Oh, and definitely show percentage growth too - sometimes a smaller product crushing it with 300% growth is more interesting than raw sales numbers. Group everything else by performance tiers so people don't get overwhelmed. Makes sense?
Here's how I'd handle it - compare your forecasts to what actually happened each month, then figure out where you went off track. Look at the numbers by product or territory first. Honestly, this becomes the best part of these meetings once everyone gets used to it. Dig into why things didn't match up - maybe the market shifted, competitors did something unexpected, or you had internal problems. Then tweak your next quarter's forecast based on what you learned. The whole point is making your predictions better over time, not just crunching numbers for the sake of it.
So here's what works for me - build it like a pyramid. Put the big picture stuff first for executives, then get into the weedy metrics your sales ops people want. Honestly, a quick context slide upfront is clutch (saves SO many dumb questions later). Break it into clear sections so people can tune out when it's not their thing. I do summary dashboards plus detailed breakdowns. Oh, and definitely prep some backup slides with extra granular stuff. You never know when someone's gonna ask for super specific data. That way everyone gets what they need without drowning in irrelevant details.
Honestly, just automate the boring stuff with your CRM dashboards - they'll pull all your performance data automatically. Set up templates once and you're golden for every month after. Tableau or Power BI are lifesavers for visualizations (way better than fighting with Excel charts that always look janky). Real-time updates mean your slides basically build themselves. First step: figure out which metrics you show every single time, then find tools that can grab and format that data for you. I probably spend like 90% less time on prep now.
Dude, visual metaphors are your best friend here - progress bars, thermometers, racing tracks to show targets vs actual numbers. Before/after slides work great too, like comparing this month to last month. Oh and those animated counters that build up to the final number? Pure gold for drama lol. Leaderboards are clutch for showing top performers. Instead of boring tables, throw in some icons or infographics. Mini case studies highlighting individual wins always hit different too. Honestly, you just want your data telling a story instead of being a snooze-fest of random numbers dumped everywhere.
Honestly, skip the boring slideshow approach and get people actually talking. Split everyone into small mixed teams to dig into different problems together. We did this thing called "wins and learns" where people shared both their successes AND their screw-ups - the failures were way more interesting, not gonna lie. Don't let the same person run everything either. Mix it up so different voices get heard. Oh, and here's something that works: start by asking what questions they have instead of just dumping data on them. You want conversation, not a lecture hall vibe.
-
I didn’t expect such a good service for the money I am paying. But, they exceed my expectations. Great work SlideTeam.
-
SlideTeam is my go-to resource for professional PPT templates. They have an exhaustive library, giving you the option to download the best slide!