


Optimum Employee Utilization Powerpoint Presentation Slides





Try Before you Buy Download Free Sample Product
 Impress Your
 Audience
 100%
100% Editable
 Save Hours
 of Time


Introducing Optimum Employee Utilization PowerPoint Presentation Slides. The presentation explains the status of current projects assigned, the need for resource optimization, concerns at business levels, and competitive analysis. Analyze employee workforce based on the capacity occupied for specific tasks in an organization through this PPT complete deck. You can also present skill level analysis based on various parameters with thoroughly researched PPT infographics. Depict team analysis, utilization of resources using these PowerPoint templates. This content-ready staff utilization PPT layouts showcase the analysis of employee efficiency. Determine the cost associated with the utilization of resources by taking advantage of resource utilization PPT themes. You can also showcase the scope of talent requirements in the future by incorporating this readily available PPT complete deck. Showcase the action plan training by explaining types, external training schedules with costs using these easy-to-use PPT templates. Analyze the impact of resource utilization by downloading an easy-to-use employee utilization calculation PPT presentation.
People who downloaded this PowerPoint presentation also viewed the following :
Content of this Powerpoint Presentation
Slide 1: This title slide introduces Optimum Employee Utilization. Add the name of your company here.
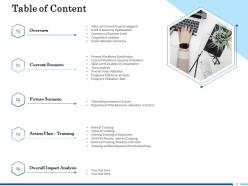
Slide 2: This slide contains the Table of Content. It includes – Overview, Current Scenario, Future Scenario, Action Plan – Training, and Overall Impact Analysis.
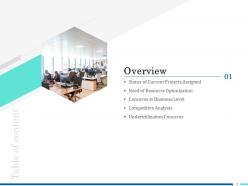
Slide 3: This is a table of content slide showing the Overview. It includes - Status of Current Projects Assigned, Need for Resource Optimization, Concerns at Business Level, Competitive Analysis, and Underutilization Concerns.
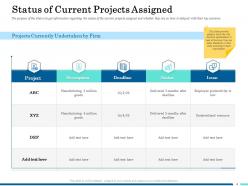
Slide 4: This slide presents the Status of Current Projects Assigned. The purpose of the slide is to get information regarding the status of the current projects assigned and whether they are on time or delayed with their key concerns.
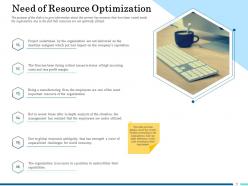
Slide 5: This slide presents the Need for Resource Optimization. The purpose of the slide is to give information about the current key concerns that have been raised inside the organization due to the fact that resources are not optimally utilized.
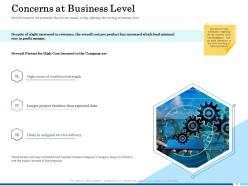
Slide 6: This slide presents the Concerns at Business Level. It provides information regarding the key concerns of the top management.
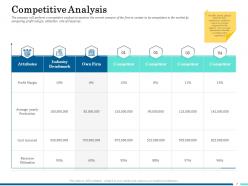
Slide 7: This slide presents the Competitive Analysis. It provides a glimpse of the firm's performance analysis in context to its major competitors in the industry.
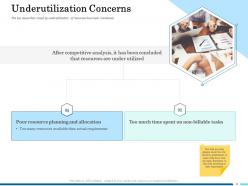
Slide 8: This slide presents the Underutilization Concerns. The key issues that are raised by the underutilization of resources have been mentioned.
Slide 9: This is a table of content slide showing the Current Scenario. It includes - Present Workforce Distribution, Current Workforce Capacity Evaluation, Skills Level Analysis by Department, Team Analysis, Overall Team Utilization, Employee Efficiency Analysis, and Employee Utilization Rate.
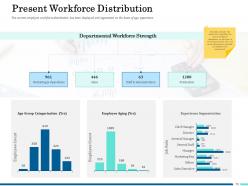
Slide 10: This slide presents the Present Workforce Distribution. It provides information regarding the current workforce distribution on the basis of several parameters.
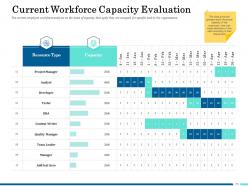
Slide 11: This slide presents the Current Workforce Capacity Evaluation. It gives a glimpse of the actual capacity of the resources.
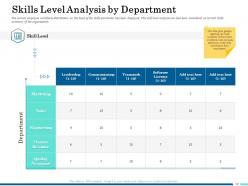
Slide 12: This slide presents the Skills Level Analysis by Department. It gives a glimpse regarding the skills inventory of the current workforce.
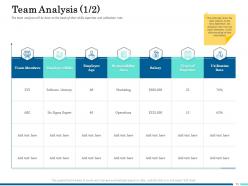
Slide 13: This slide presents the Team Analysis (1/2). It shows the team analysis on the basis of experience and utilization rate.
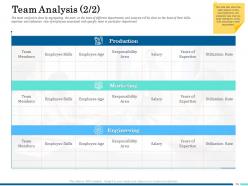
Slide 14: This slide presents the Team Analysis (2/2). It shows the team analysis on the basis of experience and utilization rate.
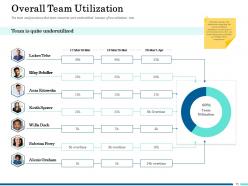
Slide 15: This slide presents the Overall Team Utilization. It shows that team resources were underutilized because of the low utilization rate.
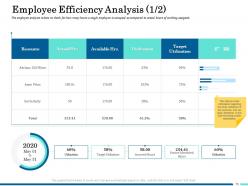
Slide 16: This slide presents the Employee Efficiency Analysis (1/2). It is done to check for how many hours a single employee is occupied as compared to actual hours of working assigned.
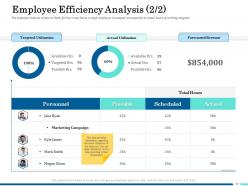
Slide 17: This slide presents the Employee Efficiency Analysis (2/2). It provides information regarding the actual utilization of the resources.
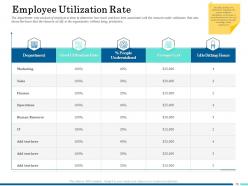
Slide 18: This slide presents the Employee Utilization Rate. It provides information regarding the current workforce distribution on the basis of several parameters.
Slide 19: This is a table of content slide showing the Future Scenario. It includes - Talent Requirement in Future and Department Wise Resource Allocation in Future.
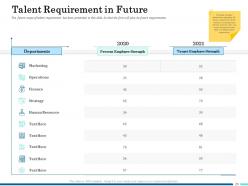
Slide 20: This slide presents the Talent Requirement in the Future. It provides information regarding the future requirement of the resource as compared to the present scenario.
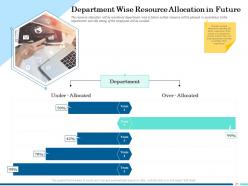
Slide 21: This slide presents the Department Wise Resource Allocation in the Future. It provides information regarding the future requirement of the resource as compared to the present scenario.
Slide 22: This is a table of content slide showing the Action Plan – Training. It includes - Need of Training, Types of Training, Internal Training of Employees, 30 60 90 Plan for Internal Training, External Training Schedule with Cost, and Training and Development Process Roadmap.
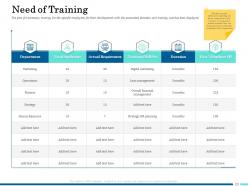
Slide 23: This slide presents the Need for Training. It provides information regarding the future requirement of the resource as compared to the present scenario.
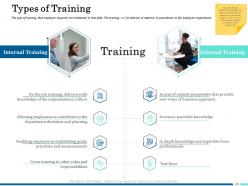
Slide 24: This slide presents the Types of Training. It provides information regarding the types of training whether internal or external are required.
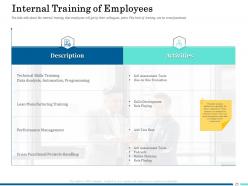
Slide 25: This slide presents the Internal Training of Employees. It provides information regarding the future requirement of the resource as compared to the present scenario.
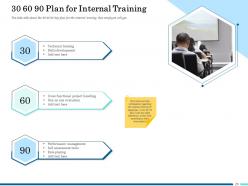
Slide 26: This slide presents the information regarding the internal training of employees in 30, 60, 90 days.
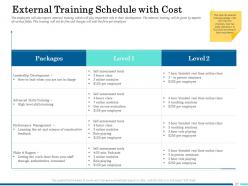
Slide 27: This slide presents the External Training Schedule with Cost. It provides information regarding the future requirement of the resource as compared to the present scenario.
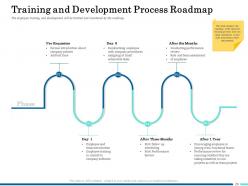
Slide 28: This slide presents the Training and Development Process Roadmap. It displays the roadmap of the resource training process.
Slide 29: This is a table of content slide showing the Overall Impact Analysis.
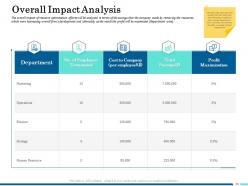
Slide 30: This slide presents the Overall Impact Analysis. It shows the total savings that the firm will make after dismissing employees from various departments.
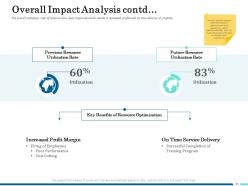
Slide 31: This slide presents the Overall Impact Analysis continued from the previous slide.
Slide 32: This is the Optimum Employee Utilization - Icons Slide.
Slide 33: This slide introduces the Additional Slides.
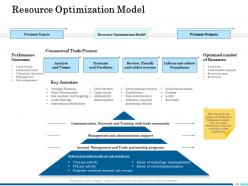
Slide 34: This slide presents the Resource Optimization Model. It gives a glimpse of the Resource Optimization Model.
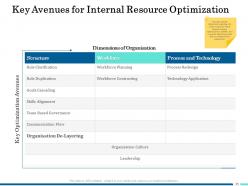
Slide 35: This slide presents the Key Avenues for Internal Resource Optimization. It provides information regarding the major avenues by which internal resource optimization is possible.
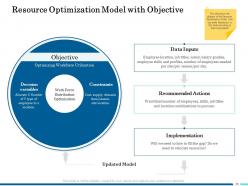
Slide 36: This slide presents the Resource Optimization Model with Objective. It gives a glimpse of the Resource Optimization Model.
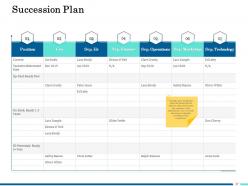
Slide 37: This slide presents the Succession Plan. It gives a glimpse of the backup plan for the effective replacement of the key resources in the organizations.
Slide 38: This slide contains the information about the company aka the ‘About Us’ section. This includes the Value Clients, the Target Audience, and Preferred by Many.
Slide 39: This slide provides the Mission for the entire company. This includes the vision, the mission, and the goal.
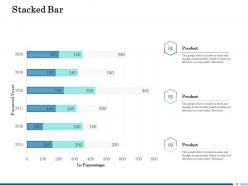
Slide 40: This slide shows a Stacked Bar that compares 3 products’ data over a timeline of financial years.
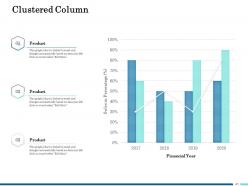
Slide 41: This slide shows a Clustered Column that compares 3 products’ sales over a timeline of financial years.
Slide 42: This is the Puzzles slide to show the parts that make up your project.
Slide 43: This is the Lego slide to show the building blocks of your project.
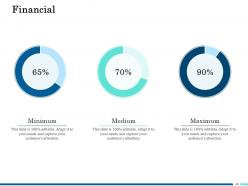
Slide 44: This slide presents the Financial with a data’s numbers at minimum, medium, and maximum percentage.
Slide 45: This is the Mind Map slide with which you can brainstorm ideas.
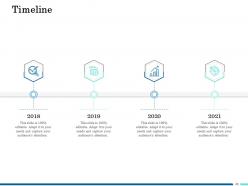
Slide 46: This slide is a Timeline template to showcase the progress of the steps of a project with time.
Slide 47: This is a Thank You slide where details such as the address, contact number, email address are added.
Optimum Employee Utilization Powerpoint Presentation Slides with all 47 slides:
Use our Optimum Employee Utilization Powerpoint Presentation Slides to effectively help you save your valuable time. They are readymade to fit into any presentation structure.






FAQs for Optimum Employee Utilization
So employee utilization is basically tracking whether your team's actually doing valuable work or just spinning their wheels. You're measuring their productive time against total capacity - think billable hours vs just being at their desk scrolling reddit (we've all been there). High utilization means you're getting solid ROI from salaries, which is usually your biggest expense anyway. Low numbers? That screams wasted resources or people burning out from terrible workload distribution. Start with the simple math - billable vs total hours. Then figure out what's sucking up all that non-productive time. It's honestly one of the best ways to spot bottlenecks and fix workflow issues.
Track billable vs. total hours and how fast projects actually get done. Toggl or Harvest work great for the data collection part, but good luck getting everyone to log consistently - it's seriously like pulling teeth. Aim for 70-85% utilization rates, though don't get obsessed with just the numbers. Client satisfaction matters way more than perfect time sheets sometimes. Check delivery times and do monthly team reviews to catch problems early. Oh and actually talk to people about their workload - burned out employees tank your metrics anyway.
So I'd definitely start with billable hours percentage - super easy to calculate and gives you a solid starting point. Just divide your billable hours by total available hours. Capacity utilization is another big one that shows how much of your team's potential workload they're actually tackling. Revenue per employee is clutch for seeing the financial side of things. Oh, and some teams track project completion rates plus time-to-delivery stuff, but honestly that varies a lot by industry. Billable percentage is probably your best bet to begin with since it's straightforward and you can build from there.
So basically, when your people spend more time on actual billable work, you make more money - pretty obvious math there. The trick is finding that sweet spot though. Around 75-85% utilization works for most teams I've seen. Push it higher and people burn out fast (learned that one the hard way). Below 75% means you're basically paying for people to scroll their phones. Nobody can sustain 100% without losing their minds. I'd start tracking where everyone's at now, then look for the obvious stuff - who's swamped versus who's twiddling their thumbs.
There's tons of options out there honestly. Toggl Track and RescueTime are pretty solid for real-time tracking - shows you exactly where everyone's spending their time. Monday.com and Asana have those built-in dashboards too if you're already using project management stuff. The real pain though? Getting people to actually log their hours consistently. I swear that's always the biggest headache. For more heavy-duty analytics, check out Replicon or TimeCamp - they'll connect with whatever systems you've got. My advice? Grab free trials of like 2-3 and see what doesn't make your team want to revolt.
Honestly, burnout hits when people are stuck at 90%+ capacity with zero wiggle room. Like, imagine redlining your car engine 24/7 - something's gonna snap eventually. I'd shoot for 80-85% utilization instead and actually build in buffer time. Rotate the brutal projects too so you're not crushing the same people over and over (learned that one the hard way). Check in weekly - not just on tasks but how everyone's actually doing. The trick is catching it early because once someone's already fried, you're basically in damage control mode.
So basically this data shows you where everyone's time actually goes - not where you *think* it goes. Pretty eye-opening honestly. You'll spot who's drowning (major burnout alert) and who could take on more stuff. If tasks are taking forever, that's your clue people need training in those areas. Plus it makes hiring decisions way easier since you know exactly what gaps you have. I'd start tracking weekly - patterns show up fast and it's kind of addictive once you see how useful it is.
Honestly, good project management software will save your sanity here. You can actually see who's drowning vs who has extra capacity, plus time-tracking apps help you spot where things get stuck. Analytics dashboards catch patterns you'd miss otherwise - and trust me, spreadsheets for this stuff is just painful. The data lets you move work around before people burn out. My coworker swears by tools that sync with whatever you're already using, which makes sense. Start small with one solid tool rather than going crazy with like five different systems.
Honestly, ditch that "squeeze every drop" approach - it's toxic. Target 70-80% utilization instead of pushing everyone to 100%. Mix up their assignments so people aren't stuck on brutal projects back-to-back. When someone says they're burned out, actually listen! I've watched good teams completely fall apart from overwork. Build in time for learning and collaboration (even some breathing room). Here's the thing though - track satisfaction scores alongside your utilization numbers, not separately. Start by looking at how work's distributed now and just ask your team what'd make things more manageable.
Honestly, cross-training is where I'd start - gets people jumping between projects instead of sitting on the bench looking bored. Better resource allocation helps too, but the real win is matching skills properly. Weekly capacity meetings sound boring but they're clutch for catching bottlenecks before they wreck everything. Oh, and chunk up those massive projects into smaller pieces. Makes redistributing work way less painful. Track your numbers weekly, not monthly - monthly is basically useless for quick fixes. Pick one thing and see how it goes first though.
So it really depends on your industry. Consulting firms usually hit 70-85% because they're literally billing clients for hours. Manufacturing cares more about keeping machines running and workers efficient. Tech companies? Most don't even bother with traditional tracking - they just want to see if you're hitting your sprint goals, which honestly makes way more sense for that type of work. Healthcare tracks patient face time. Retail looks at sales per hour worked. The trick is figuring out what "productive" actually means for your specific situation and measuring stuff that actually moves the needle for your business.
Ugh, underutilization is the worst - it just sucks all the energy out of teams. People get frustrated when they're not challenged and basically start mentally checking out. Your high performers especially will question if they even matter there. Then collaboration tanks because nobody feels motivated to actually contribute anything meaningful. It's this weird domino effect, you know? You end up with everyone just going through the motions instead of actually being engaged. Definitely worth checking how you're distributing work and asking people if they feel challenged enough. Trust me, the sluggish team vibe is real.
Honestly, track who's doing what first - you'll probably be shocked at how much your top people are actually handling. Move some stuff to whoever's got bandwidth or grab temp help during crazy times. The annoying thing is your best workers won't say anything until they're totally fried. Regular check-ins are key, and actually ask about their stress levels directly. Make it cool for people to push back on random requests too. I'd say watch everyone's workload weekly because once someone hits that 90% mark consistently, things go downhill fast.
Be really upfront about what those utilization numbers actually mean and why they're tracking them. Monthly check-ins beat the hell out of waiting for annual reviews - give people dashboards they can understand and won't stress them out. Honestly, I've watched teams panic over hitting 85% when that's totally normal, not some red alert situation. Connect the dots for them - show how utilization ties to keeping projects on track and jobs stable. People aren't mind readers. Frame it as everyone working toward the same goal instead of pointing fingers at individuals. Oh, and leave room for questions because trust me, they'll have them.
So here's the thing - training actually makes your utilization rates go up, not down. Your team gets way more efficient at what they're already doing, plus they can tackle those higher-paying projects clients love. Cross-training is honestly where the magic happens though. People can jump between different projects when things get crazy busy or slow. I watched one team go from like 65% to over 80% utilization just by teaching everyone some adjacent skills. Yeah, you'll lose some billable hours upfront during training, but it pays off fast when your people can handle more profitable work.
-
Graphics are very appealing to eyes.
-
Excellent work done on template design and graphics.
-
Easily Editable.
-
Visually stunning presentation, love the content.