

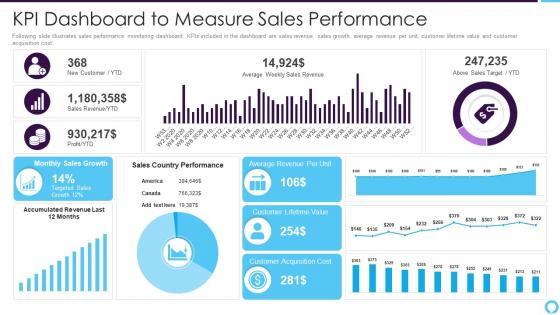
Partner relationship management kpi dashboard to measure sales performance




Try Before you Buy Download Free Sample Product
 Impress Your
 Audience
 100%
100% Editable
 Save Hours
 of Time


Following slide illustrates sales performance monitoring dashboard. KPIs included in the dashboard are sales revenue, sales growth, average revenue per unit, customer lifetime value and customer acquisition cost.
People who downloaded this PowerPoint presentation also viewed the following :
Partner relationship management kpi dashboard to measure sales performance with all 7 slides:
Use our Partner Relationship Management Kpi Dashboard To Measure Sales Performance to effectively help you save your valuable time. They are readymade to fit into any presentation structure.





FAQs for Partner relationship management kpi dashboard to
Essential PRM KPIs include partner acquisition rate, revenue per partner, deal registration volume, certification completion rates, and partner satisfaction scores. These metrics streamline partnership oversight by measuring recruitment effectiveness, financial performance, and engagement levels, with many organizations finding that tracking lead conversion rates, time-to-productivity, and co-marketing participation ultimately delivers enhanced partner alignment and accelerated revenue growth.
Organizations can effectively measure partner satisfaction by tracking partner Net Promoter Scores, support ticket resolution times, contract renewal rates, and collaborative project success metrics through comprehensive KPI dashboards. These integrated measurements enable companies to identify relationship gaps early, streamline communication processes, and enhance partnership value propositions, with many enterprises finding that proactive satisfaction monitoring ultimately delivers stronger strategic alliances and improved joint revenue performance.
Data visualization transforms complex partner performance metrics into intuitive charts, graphs, and heat maps that enable quick identification of trends, bottlenecks, and opportunities across partner networks. These visual elements streamline decision-making by presenting revenue contributions, engagement levels, and performance benchmarks in easily digestible formats, with many organizations finding that visual dashboards reduce analysis time while enhancing strategic partner management and operational efficiency.
Organizations should update their partner KPI dashboards monthly for comprehensive reviews, with weekly updates for critical metrics like sales performance, compliance rates, and customer satisfaction scores. This frequency enables timely identification of performance trends, relationship issues, and growth opportunities, while many companies find that real-time dashboards for key indicators help maintain strategic partnerships and drive competitive advantage.
Common pitfalls include tracking too many metrics, focusing solely on lagging indicators, poor data integration, lack of stakeholder input, and unclear visualization design. These challenges often result in dashboard overload and reduced usability, with many organizations finding that starting with 5-7 core KPIs, involving partners in the design process, and ensuring real-time data accuracy delivers more actionable insights and stronger partner engagement.
Predictive analytics integrates into PRM KPI dashboards through machine learning algorithms, historical data analysis, automated forecasting models, and real-time performance monitoring that identifies declining engagement patterns before they escalate. These technologies enable organizations to proactively address partner satisfaction issues, optimize resource allocation, and prevent revenue losses, with many companies finding that predictive insights ultimately enhance partner retention rates and accelerate collaborative growth opportunities.
**INPUT**: What types of data sources are most valuable for compiling a comprehensive PRM KPI dashboard? **OUTPUT**: Valuable PRM KPI dashboard data sources include CRM systems, partner portals, sales platforms, marketing automation tools, and financial systems. These integrated sources streamline partner performance tracking by consolidating revenue metrics, lead conversion rates, and engagement analytics, with many organizations finding that this comprehensive approach ultimately delivers enhanced partner visibility and strategic decision-making capabilities.
Qualitative metrics can be incorporated through sentiment analysis of partner feedback, satisfaction scores from surveys, relationship health assessments, and structured commentary fields alongside quantitative data. These approaches enable organizations to capture partner perceptions, trust levels, and communication effectiveness, while many companies find that combining numeric targets with qualitative insights delivers more comprehensive relationship visibility and strategic decision-making capabilities.
A PRM KPI dashboard improves communication by providing real-time visibility into partner performance, shared goals, and mutual outcomes through centralized data access, automated reporting, and transparent metrics tracking. This enhanced transparency enables proactive discussions around challenges and opportunities, while streamlining regular reviews and strategic planning sessions, ultimately delivering stronger partnerships and improved collaborative efficiency across all partner relationships.
User feedback refines PRM KPI dashboards by identifying visualization preferences, highlighting missing metrics, and revealing workflow inefficiencies that impact partner engagement tracking. Through systematic feedback collection, organizations can enhance dashboard usability, customize reporting features, and streamline navigation paths, ultimately delivering more intuitive interfaces and actionable insights for partner managers.
Organizations should assess PRM program effectiveness using benchmarks like partner engagement rates, revenue attribution, deal registration volumes, certification completion rates, and time-to-productivity metrics. These benchmarks enable companies to measure partner performance across recruitment, enablement, and revenue generation, with many finding that tracking 90-day partner activation rates and year-over-year revenue growth delivers comprehensive insights into program success.
Automation tools enhance PRM KPI dashboard data collection by eliminating manual entry, integrating multiple data sources in real-time, and standardizing metrics across partner channels. These technologies streamline operations by reducing human error, accelerating reporting cycles, and enabling continuous monitoring, with many organizations finding that automated collection delivers faster insights and improved partner performance visibility.
Partnership value metrics include cumulative revenue growth, customer lifetime value increases, market expansion rates, joint innovation outcomes, and strategic goal alignment scores. These indicators enable organizations to assess partnership ROI beyond immediate transactions, with many companies finding that tracking cross-referral success, shared resource efficiency, and collaborative project completion rates ultimately delivers deeper strategic insights and sustainable competitive advantages.
Industries tailor partner KPI dashboards to reflect sector-specific priorities, with retail focusing on sales velocity and inventory turnover, financial services emphasizing compliance scores and risk metrics, and manufacturing tracking supply chain reliability and quality standards. These customized approaches enable organizations to measure what matters most for their business model, ultimately delivering more strategic partner relationships and competitive advantage in their respective markets.
Stakeholder involvement is crucial for PRM KPI dashboard success, as it ensures the metrics align with business objectives, user needs, and strategic priorities across different departments and partner tiers. When sales teams, partner managers, and executives actively participate in dashboard design, organizations achieve higher adoption rates, more accurate performance insights, and better strategic alignment, ultimately delivering enhanced partner relationships and measurable ROI improvements.
-
Visually stunning presentation, love the content.
-
Excellent work done on template design and graphics.