

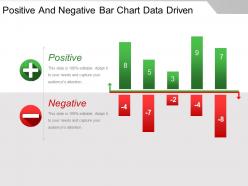
Graphique à barres positives et négatives guide de présentation PowerPoint basé sur les données





Try Before you Buy Download Free Sample Product
 Impress Your
Audience
 100%
Editable
 Save Hours
of Time


Votre guide de présentation PowerPoint à barres positives et négatives basé sur les données vous permet de faire face. Les difficultés ne pourront jamais vous déstabiliser.
People who downloaded this PowerPoint presentation also viewed the following :
Graphique à barres positives et négatives avec guide PowerPoint basé sur les données, comprenant les 5 diapositives.
Encouragez les gens à acquérir une expertise avec notre guide de présentation PowerPoint sur les graphiques à barres positives et négatives basés sur les données. Convainquez-les qu'ils se sentiront autonomisés.


FAQs for Positive and negative bar chart data
Okay so bar charts - first thing is making sure your labels actually make sense and putting bars in some kind of order that isn't random. I always go alphabetical or by size. Don't use crazy colors (my eyes are still recovering from this rainbow monstrosity my coworker made last week). Your bars need to start at zero or you'll accidentally make small differences look huge. Space everything evenly, throw a decent title on there, and honestly? Show it to someone else first. If they give you that confused squinting face, you've got more work to do. Simple beats fancy every time.
Oh man, colors are huge for this stuff. Similar colors will confuse people - they'll think those bars are related when they're not. Also red screams "bad" and green means "good" to most people, so don't just grab random colors or you'll mess with how they read your data. For ordered data, use colors that flow together. But categories? Make them pop against each other. Here's something I learned the hard way - always check how it looks in grayscale first. Saves you from that awkward moment when your colorblind coworker can't tell anything apart.
For time series stuff, vertical bars are your friend - way easier to follow that left-to-right timeline flow. Short labels? Go vertical. But honestly, horizontal bars are a lifesaver when you've got those annoyingly long category names (nobody wants to crane their neck reading sideways text). Plus they're better for quick value comparisons since your eye can scan across more naturally. I usually just stick with vertical unless the labels start looking like a mess. Random tip that saved me tons of time: anything longer than 5-6 characters, just go horizontal and call it a day.
Starting your y-axis at zero shows the real proportional differences, but honestly? Sometimes that makes tiny changes disappear completely. Non-zero starting points help highlight trends - just don't try to trick people who might miss that detail. Gridline spacing is weirdly important too. Too many lines and your chart looks messy. Too few and nobody can read actual values. I always think about what point I'm trying to make first, then pick the scale that tells that story best. Oh, and label everything clearly so people know what they're looking at.
Okay so bar charts are perfect when you're dealing with categories - like sales by region, survey results, or comparing different products. You want distinct groups, not continuous data. They're amazing for spotting your winners and losers right away. Monthly website traffic? Great use case. Revenue by department? Also solid. I mean, you could use a line chart but honestly that's better for trends over time. The whole point is making quick comparisons super obvious. Your audience will instantly see what's performing and what isn't without having to think too hard about it.
Clustered bars are your best bet here - just put the related bars next to each other so people can actually compare them. Use different colors for each dataset and throw in a legend. Don't go crazy with too many datasets though, like 3-4 max or it looks like a rainbow threw up on your chart. Keep the bar widths the same and give each group some breathing room. Honestly, the whole point is making it super obvious what's going on without people having to squint and decode your masterpiece. Oh, and definitely show it to someone else first - you'd be surprised how often something makes perfect sense to you but zero sense to literally everyone else.
Don't start your y-axis anywhere but zero - seriously, it makes tiny differences look huge and misleading. Also avoid cramming tons of categories together. Skip the 3D effects too, they're just distracting noise. Keep all your bars the same width unless you've got a real reason not to. Make sure people can actually read your labels without doing neck gymnastics. Oh, and I learned this the hard way - always double-check what your axis is actually measuring before you finalize anything. Clean and simple beats fancy every time.
So basically, you can compare stuff way easier when you group bars side-by-side - like checking how each product does across different regions. Stacked bars are perfect for that part-to-whole thing, though honestly most people just default to pie charts for some reason. With stacked, you'll see the total AND how each piece contributes. Short version: go grouped when you want to compare individual numbers. Pick stacked when the composition story matters more. Both beat having like five separate charts that nobody wants to flip through.
Honestly, grouped bar charts are perfect when you're comparing stuff across different categories or time periods. Say you've got sales data for multiple products in different regions - a regular bar chart would look like a hot mess. With grouped bars, you can spot patterns within each group while still comparing everything side by side. They work really well for before/after situations too, or when you have subcategories that belong together. Just don't overdo it with too many groups or it gets way too cluttered. I'd suggest mocking up both versions and seeing which one actually makes sense with your data.
Dude, seriously - good labeling makes or breaks your bar chart. Without clear axis labels, people are just staring at random rectangles trying to figure out what's going on. Data labels on the bars help too when you need precision. I've sat through way too many presentations where I'm squinting at charts like "what does this even measure??" Your axis titles should be specific enough that anyone can get it instantly. Oh and here's the thing - if someone needs more than 10 seconds to understand your chart because the labeling sucks, you've already lost them. Don't make people work that hard!
Dude, interactive bar charts are SO much better for presentations. You can add hover tooltips showing exact values, or clickable parts that drill into specific data. Filters let people explore different time periods too - honestly beats having your audience squint at tiny static numbers. The best part? When someone asks "what about Q3 sales" you don't need 15 backup slides ready. You just click and show them right there. Even basic hover effects make a huge difference. People actually stay engaged instead of zoning out. Start simple though - you don't need fancy animations or whatever.
Honestly, stick to like 5-7 bars tops. More than that and people just zone out completely. I made this mistake once with some crazy 15-bar chart - total disaster! If you've got a million categories, just lump the tiny ones into "Other" or split it into separate charts. Mobile viewing is brutal too - you can maybe squeeze 4-5 bars before it becomes unreadable. Oh, and think about where you're presenting. People in the back row need to actually see your labels, which sounds obvious but... yeah. Just start with your most important stuff and cut anything that doesn't really add to the story you're telling.
Definitely mix bar charts with other stuff! Line graphs are perfect for showing trends over time. I always toss in a data table too - some people are obsessed with seeing the actual numbers. Pie charts can break down the "why" behind your data. Maps work if location's relevant to your story. The key? Don't just throw visuals everywhere. Each one should actually add something new. I've seen too many presentations that are basically visual vomit. Start with what you're trying to say, then pick charts that support different pieces of that message.
Honestly, just go with whatever your team already knows - then build from there. Tableau and Power BI are solid if you want that drag-and-drop thing but with way more customization than Excel. Python's matplotlib is amazing once you figure it out (though there's definitely a learning curve). D3.js gives you insane control for web stuff but man, it can be frustrating at first. Even Google Sheets works fine for simple charts. The real trick? Pick something you'll actually use and update regularly instead of fighting with constantly.
Put your annotations right next to the bars that actually matter - outliers, weird trends, whatever's driving your main point. Callout boxes work great, or just use arrows pointing straight at the data. Don't go overboard though (I've definitely made that mistake before). Keep the text short but specific. Focus on the "why should I care" moments - like explaining that massive spike or random dip. Oh, and make sure people can actually read your annotations against the background. You want folks looking exactly where you want them to, not squinting around trying to figure out what's important.
-
Easy to edit slides with easy to understand instructions.
-
Innovative and Colorful designs.