Predictive Modelling Powerpoint Presentation Slides
Predict business outcomes with Predictive Modelling PowerPoint Presentation Slides. Identify outliers in a data and determine any fraud activity using predictive modelling PPT presentation templates. Use content-ready predictive modelling PowerPoint presentation layout for CRM to find out customers who are likely to purchase from you. Other than this, incorporate predictive modelling PPT slideshow for various other applications such as disaster management, capacity planning, change management, engineering, and more. This deck comprises of templates that will help you collect and analyse data to identify the chances of future outcomes based on historical data. It has PPT slides like predictive analytics steps, define project, data collection, data analysis, statistics results, predictive analytics stages, predictive analytics benefits, and more. Discover what kind of products and services consumers might be interested in and what attracts them with predictive analytics PPT templates. Use prediction interval for your company to increase bottom line and competitive advantage. Have statistical model PowerPoint slideshow to produce valuable information. Our Predictive Modelling Powerpoint Presentation Slides have the impact of being succinct and to the point.
- Google Slides is a new FREE Presentation software from Google.
- All our content is 100% compatible with Google Slides.
- Just download our designs, and upload them to Google Slides and they will work automatically.
- Amaze your audience with SlideTeam and Google Slides.
-
Want Changes to This PPT Slide? Check out our Presentation Design Services
- WideScreen Aspect ratio is becoming a very popular format. When you download this product, the downloaded ZIP will contain this product in both standard and widescreen format.
-

- Some older products that we have may only be in standard format, but they can easily be converted to widescreen.
- To do this, please open the SlideTeam product in Powerpoint, and go to
- Design ( On the top bar) -> Page Setup -> and select "On-screen Show (16:9)” in the drop down for "Slides Sized for".
- The slide or theme will change to widescreen, and all graphics will adjust automatically. You can similarly convert our content to any other desired screen aspect ratio.
Compatible With Google Slides

Get This In WideScreen
You must be logged in to download this presentation.
PowerPoint presentation slides
Presenting predictive modelling PowerPoint presentation slides. Complete pre-designed deck of 20 content ready PPT templates. These templates are completely editable. Change the colour, text and font size as per your requirement. Easy to download. Can be easily converted into PDF or JPG formats. These PPT slides are well compatible with Google slides. Download now.
People who downloaded this PowerPoint presentation also viewed the following :
Content of this Powerpoint Presentation
Slide 1: This slide introduces Predictive Modelling. State Your Company Name and get started.
Slide 2: This is an Agenda slide. State your agendas here.
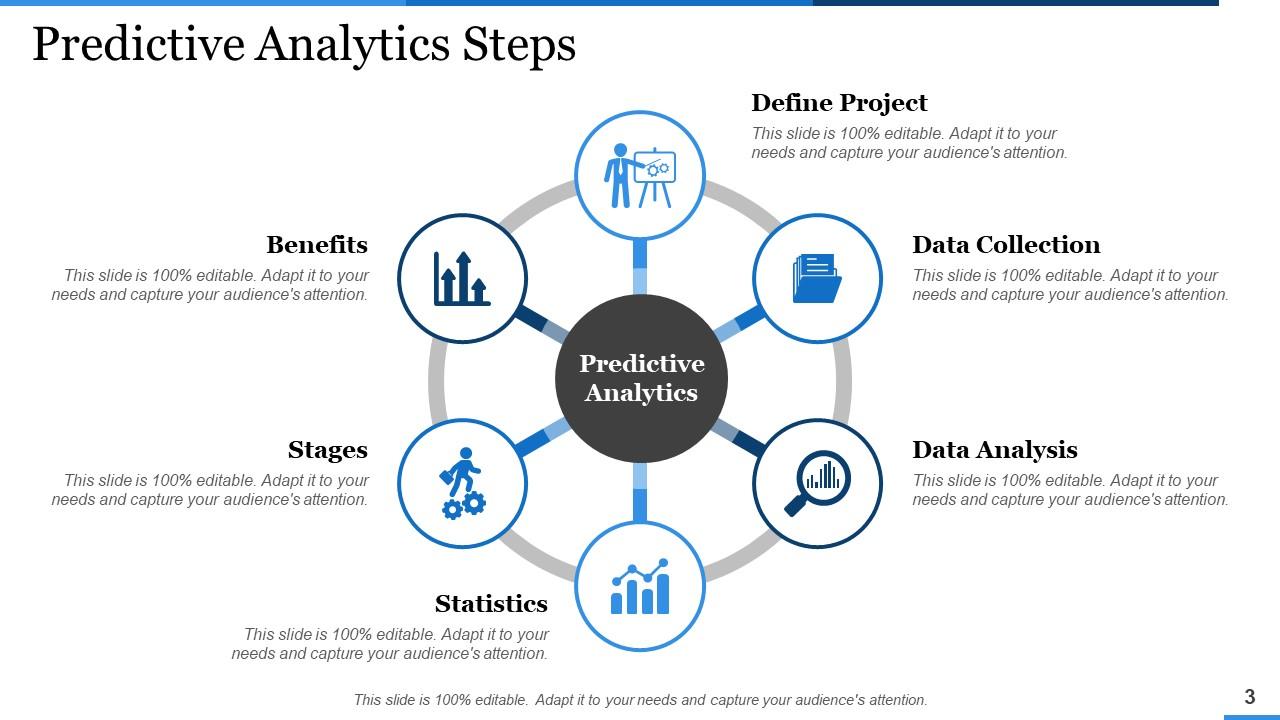
Slide 3: This slide presents Predictive Analytics Steps with the folowing points- Define Project, Statistics, Data Analysis, Stages, Data Collection, Benefits.
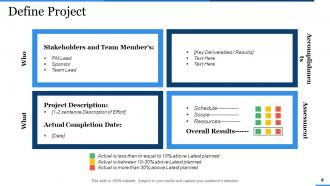
Slide 4: This slide presents Define Project Who {Stakeholders and Team Member's, (PM Lead Sponsor Team Lead)} What {(Project Descriptio, Actual Completion Date} Assessment/Overall Results (Schedule, Scope, Resources)
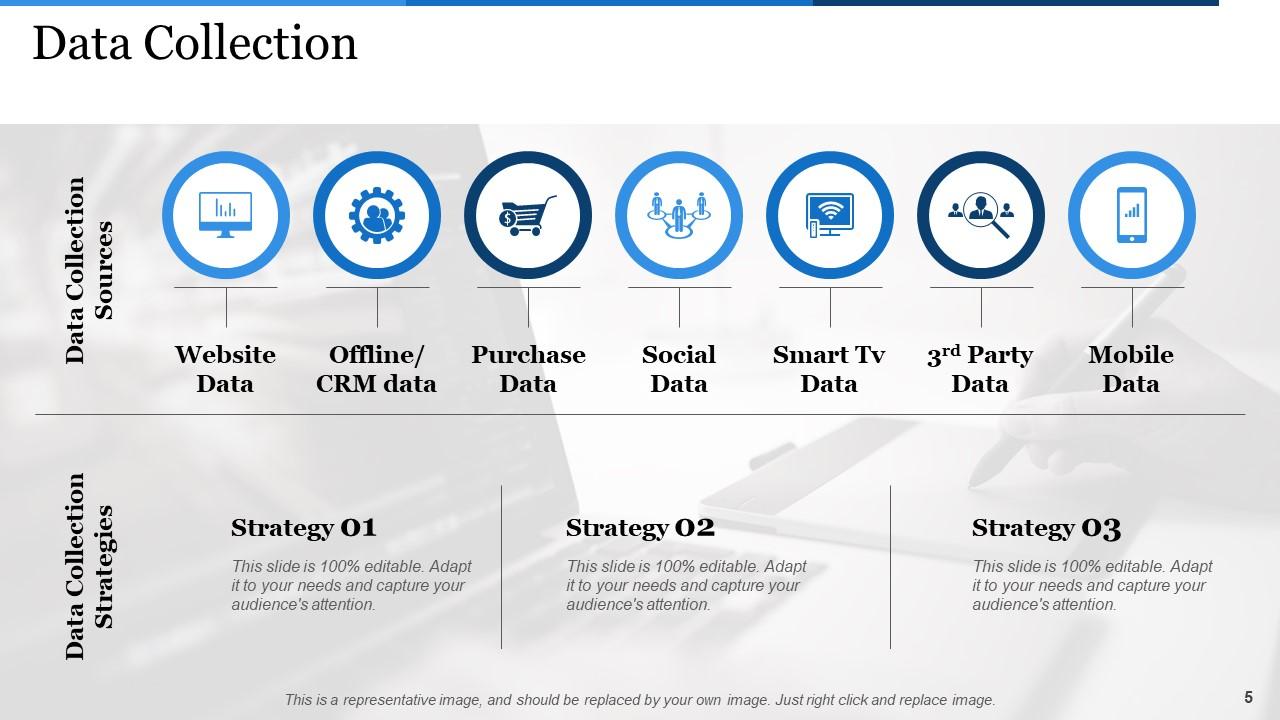
Slide 5: This slide shows Data Collection with- Data Collection Sources: Website Data, Offline/ CRM data, Purchase, Data, Social Data, Smart Tv Data, 3rd Party Data, Mobile Data, and Data Collection Strategies.
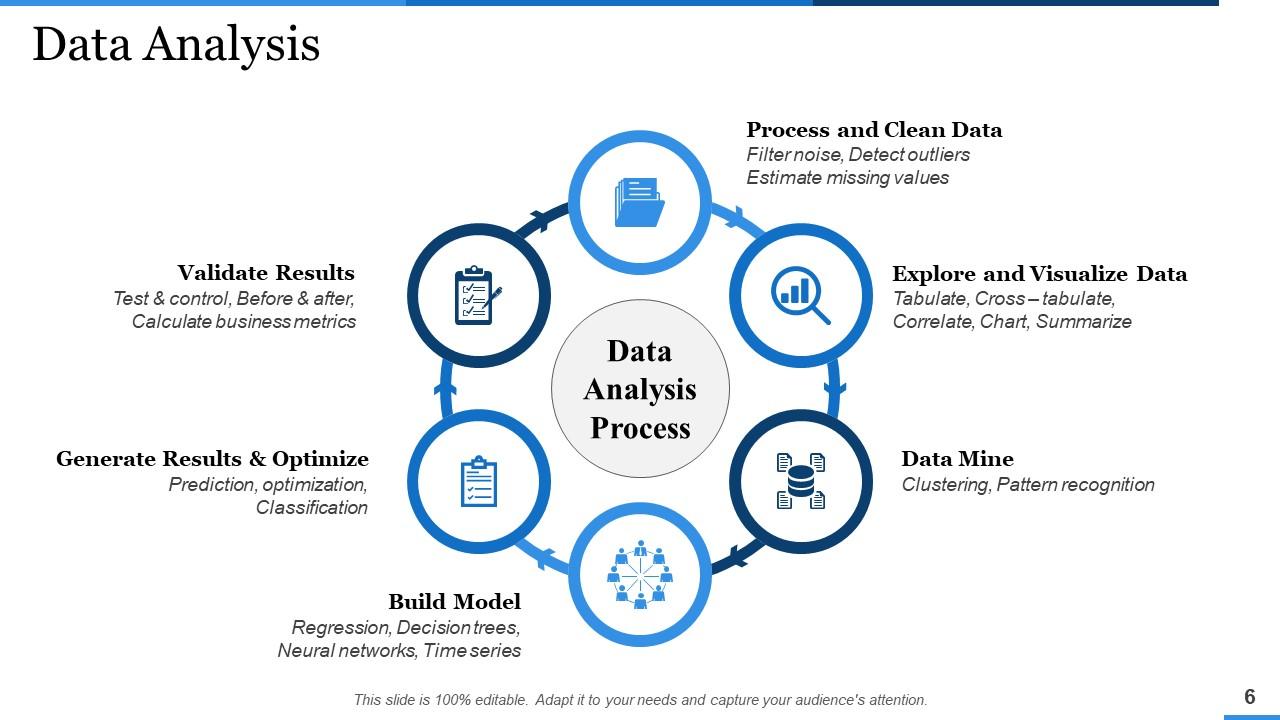
Slide 6: This slide presents Data Analysis with the following points- Process and Clean Data (Filter noise, Detect outliers, Estimate missing values) Build Model (Regression, Decision trees, Neural networks, Time series) Data Mine (Clustering, Pattern recognition) Generate Results & Optimize (Prediction, optimization, Classification) Explore and Visualize Data (Tabulate, Cross – tabulate, Correlate, Chart, Summarize) Validate Results (Test & control, Before & after, Calculate business metrics). Data Analysis Process.
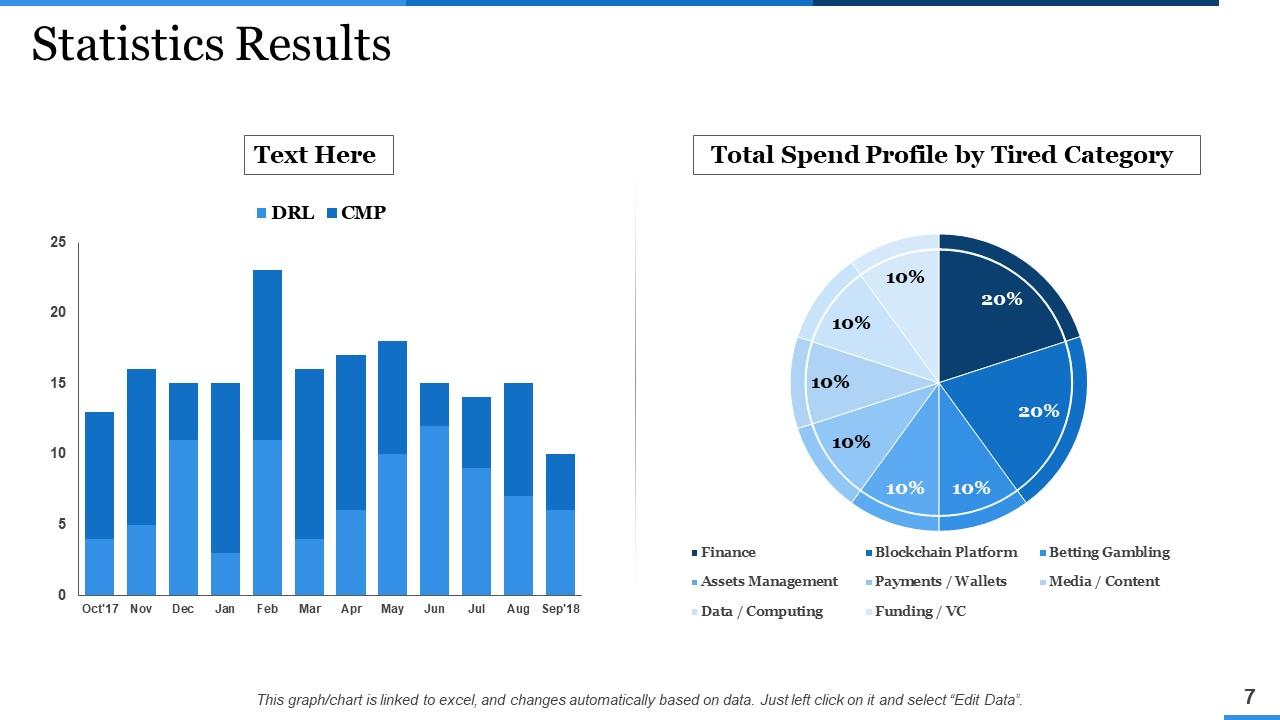
Slide 7: This slide presents Statistics Results with- Total Spend Profile by Tired Category etc.
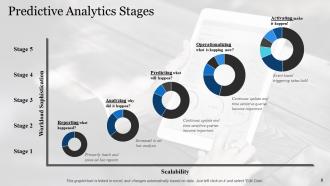
Slide 8: This slide displays Predictive Analytics Stages in terms of Scalability and Workload Sophistication. The constituents are- Reporting what happened? Primarily batch and some ad hoc reports. Analyzing why did it happen? Increased in ad hoc analysis. Predicting what will happen? Continues update and time sensitive queries become important. Operationalizing what is happing now? Continues update and time sensitive queries become important. Activating make it happen! (Event based triggering takes hold).
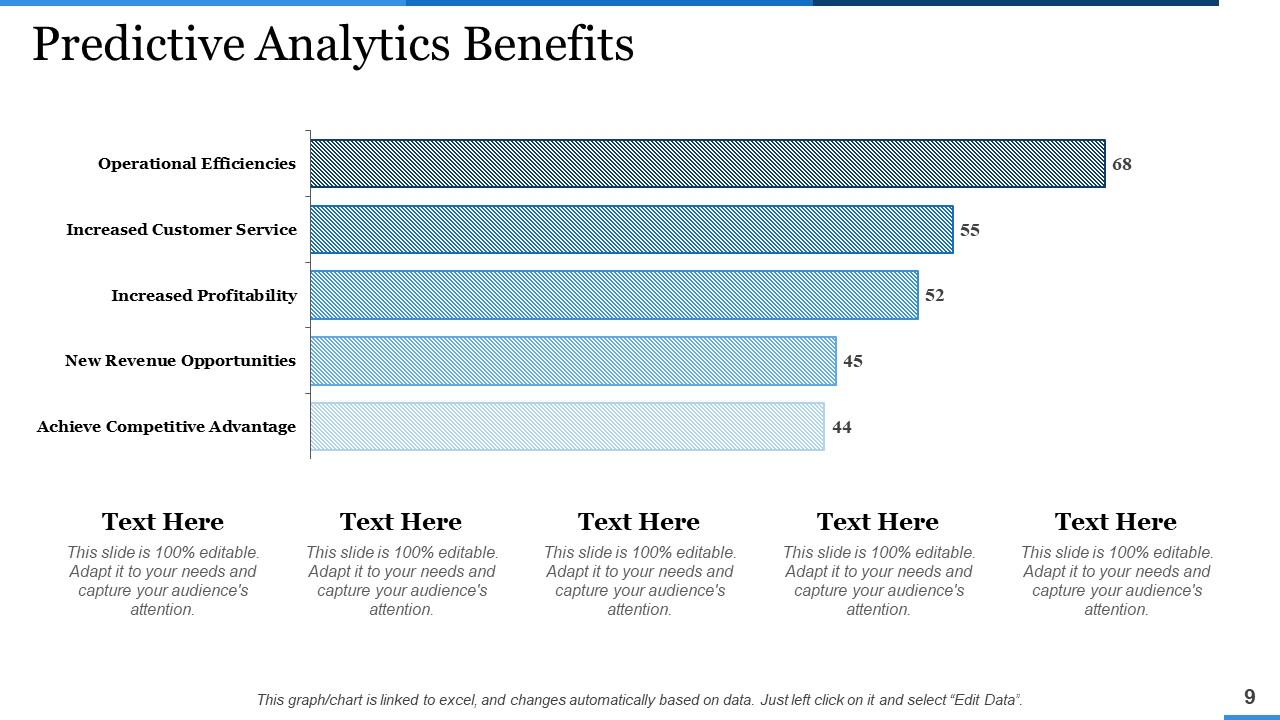
Slide 9: This slide presents Predictive Analytics Benefits. State them here in graph form.
Slide 10: This is Predictive Modelling Icons Slide. Use icons as per need.
Slide 11: This is a Tea Break image. This is a representative image and should be replaced by your own image.
Slide 12: This slide is titled Additional Slides to proceed forward.
Slide 13: This slide presents Our Team with name, designation and image boxes to state.
Slide 14: This slide shows Our Target. State them here.
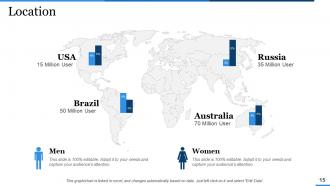
Slide 15: This is a Location slide of world map to present global presence growth etc.
Slide 16: This is a Magnifying Glass slide to state information, sepcifications etc.
Slide 17: This slide is titled Charts & Graphs to proceed forward.
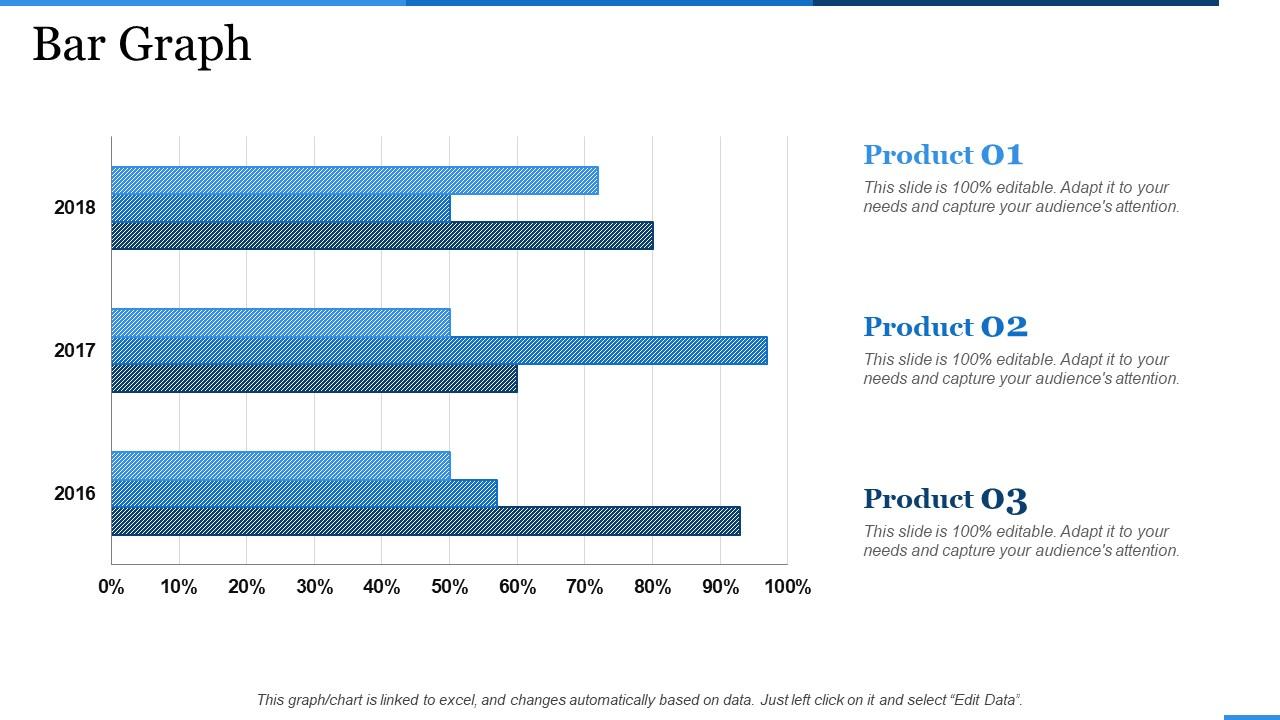
Slide 18: This is a Bar Graph slide to show product/entity comparison etc.
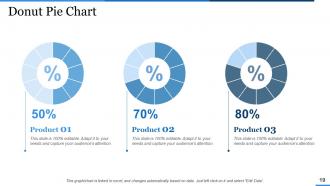
Slide 19: This is a Donut Pie chart slide to show product/entity comparison etc.
Slide 20: This is a Thank You slide with Address# street number, city, state, Contact Number, Email Address.
Predictive Modelling Powerpoint Presentation Slides with all 20 slides:
Compete effectively with our Predictive Modelling Powerpoint Presentation Slides. Your actions will be better coordinated.
-
Very well designed and informative templates.
-
Great quality slides in rapid time.


