


Project Appraisal Powerpoint Presentation Slides





Try Before you Buy Download Free Sample Product
 Impress Your
 Audience
 100%
100% Editable
 Save Hours
 of Time


Establish communication between groups with our Project Appraisal Powerpoint Presentation Slides. It helps connect the clusters.
People who downloaded this PowerPoint presentation also viewed the following :
Content of this Powerpoint Presentation
Slide 1: This is an introductory slide to PROJECT APPRAISAL. Enter your company name and begin.
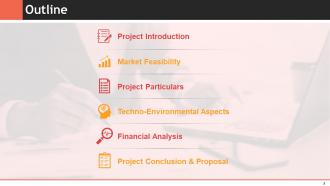
Slide 2: This slide presents Outline with the following constituents- Project Introduction, Market Feasibility, Project Particulars, Financial Analysis, Techno-Environmental Aspects, Project Conclusion & Proposal.
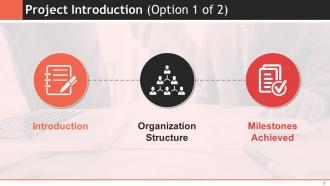
Slide 3: This is Project Introduction (Option 1 of 2) slide showing- Introduction, Milestones Achieved, Organization Structure.
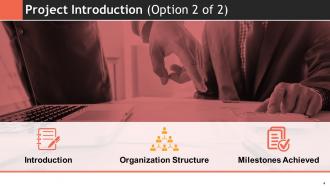
Slide 4: This slide also presents Project Introduction (Option 2 of 2) with the following points to be stated- Introduction, Milestones Achieved, Organization Structure.
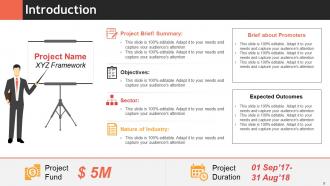
Slide 5: This is an Introduction slide with relevant imagery. Present the following aspects here- Project Name, Project Fund, Project Duration, Project Brief/ Summary, Brief about Promoters, Sector, Nature of Industry, Objectives, Expected Outcomes.
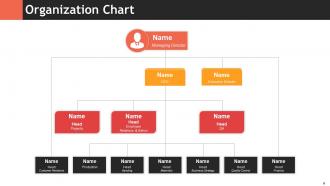
Slide 6: This slide presents Organization Chart with name, designation etc. to be displayed.
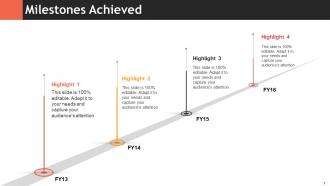
Slide 7: This slide presents Milestones Achieved in a taimeline form. Use it to state your various milestones achieved or to be achieved.
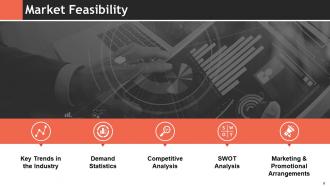
Slide 8: This slide showcases Market Feasibility with respect to- Key Trends in the Industry, Demand Statistics, Competitive Analysis, SWOT Analysis, Marketing & Promotional Arrangements.
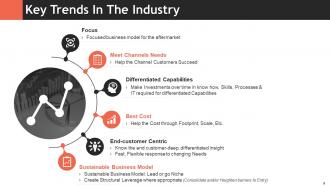
Slide 9: This slide states Key Trends In The Industry. Some of them are- Meet Channels Needs, Focus, Differentiated Capabilities, Best Cost, End-customer Centric, Sustainable Business Model.
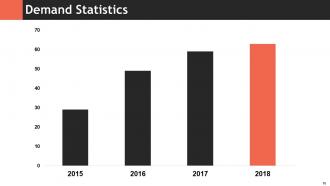
Slide 10: This slide presents Demand Statistics in a graphical form. Use it to show your own demand statisics.
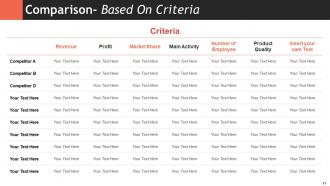
Slide 11: This slide presents Comparison- Based On Criteria table. Use it for comparison, analysis etc.
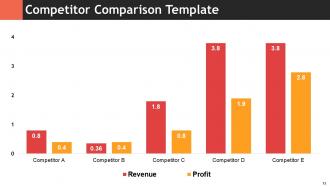
Slide 12: This slide presents Competitor Comparison Template in a graphical form. Showcase your various Competitors with Revenue and Profit here.
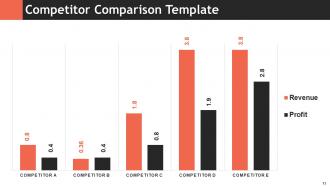
Slide 13: This is another slide presenting Competitor Comparison Template graph. Use it as per your requirement.
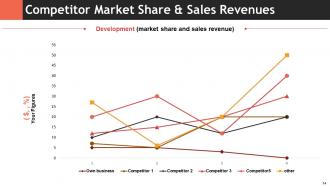
Slide 14: This slide showcases Competitor Market Share & Sales Revenues graph.
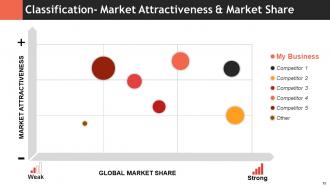
Slide 15: This is Classification- Market Attractiveness & Market Share matrix slide ranging form Weak to Strong and vice versa.
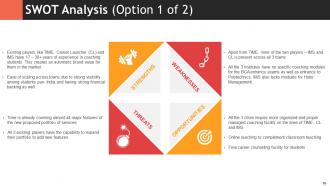
Slide 16: This slide presents SWOT Analysis (Option 1 of 2). Showcase your threats, weaknesses etc. here.
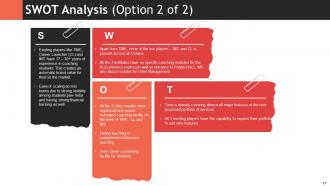
Slide 17: This slide also shows SWOT Analysis (Option 2 of 2). Use it as per your need.
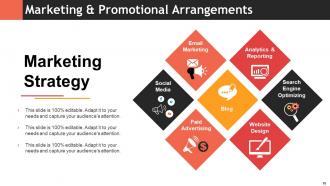
Slide 18: This slide presents Marketing & Promotional Arrangements with Marketing Strategy. We have mentioned some of its components, you can make use of them or alter as per need.
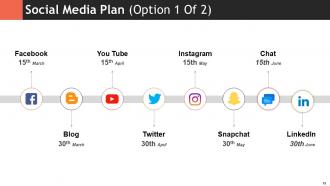
Slide 19: This slide shows Social Media Plan (Option 1 Of 2) with their respective icon imagery.
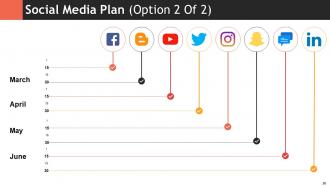
Slide 20: This slide also presents Social Media Plan (Option 2 Of 2) in a timeline form. Use as per your requirement.
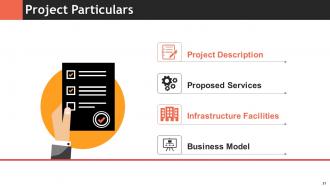
Slide 21: This slide presents Project Particulars with- Project Description, Proposed Services, Infrastructure Facilities, Business Model.
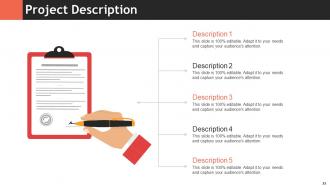
Slide 22: This is a Project Description slide. Add the description of your project in the given text boxes.
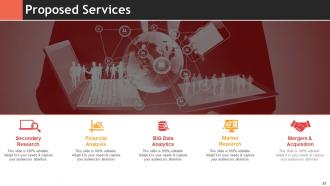
Slide 23: This slide shows Proposed Services which involve- Secondary Research, Financial Analysis, BIG Data Analytics, Market Research, Mergers & Acquisition.
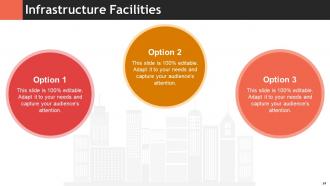
Slide 24: This is an Infrastructure Facilities slide. State them here and make use of it.
Slide 25: This is a Coffee Break image slide. Alter/ modify according to your need.
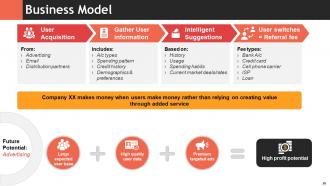
Slide 26: This slide presents Business Model. We have mentioned few of its aspects and factors, you can alter them as per your need.
Slide 27: This slide shows Techno-Environmental Feasibility with two factors- Technical Feasibility, Environmental & Legal Aspects.
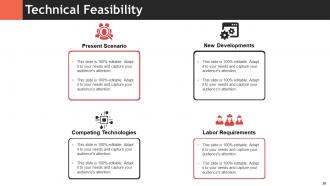
Slide 28: This is Technical Feasibility slide showing- Present Scenario, New Developments, Competing Technologies, Labor Requirements.
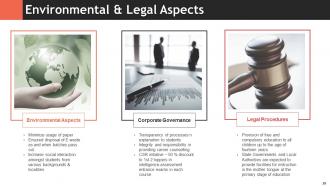
Slide 29: This slide shows Environmental & Legal Aspects. We have stated three of them which are- Corporate Governance, Legal Procedures, Environmental Aspects. Alter on the basis of your need.
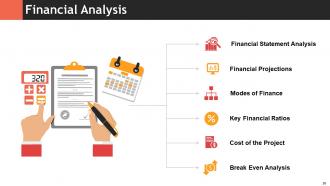
Slide 30: This is Financial Analysis slide showing- Cost of the Project, Modes of Finance, Financial Statement Analysis, Financial Projections, Break Even Analysis, Key Financial Ratios.
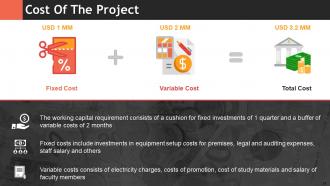
Slide 31: This slide shows Cost Of The Project with- Fixed Cost, Variable Cost, Total Cost.
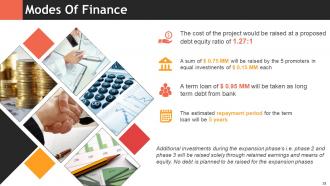
Slide 32: This slide shows Modes Of Finance with imagery. Show finance related stuff here.
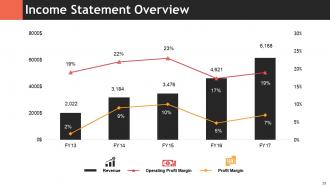
Slide 33: This slide presents Income Statement Overview graph showing the following aspects- Revenue, Operating Profit Margin, Profit Margin.
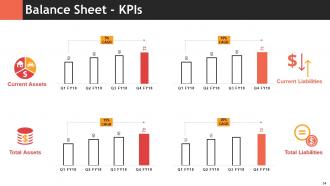
Slide 34: This is a Balance Sheet - KPIs slide showing- Current Assets, Current Liabilities, Total Liabilities, Total Assets.
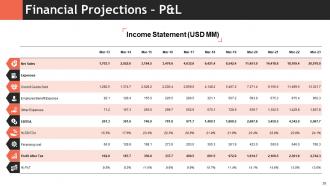
Slide 35: This slide presents Financial Projections – P&L with Income Statement (USD MM) table.
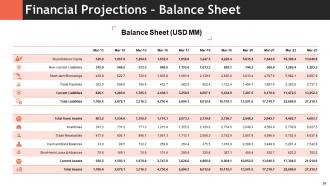
Slide 36: This slide shows Financial Projections – Balance Sheet. Add relevant data here and use it.
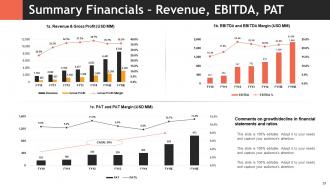
Slide 37: This slide shows Summary Financials – Revenue, EBITDA, PAT.
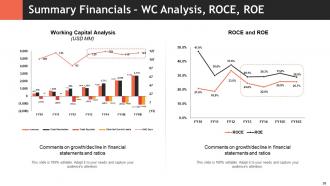
Slide 38: This is another slide presenting Summary Financials – WC Analysis, ROCE, ROE in a graphical form.
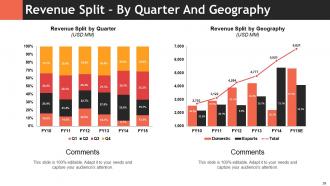
Slide 39: This slide presents Revenue Split – By Quarter And Geography in a graphical form.
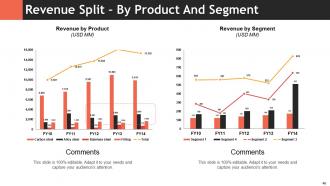
Slide 40: This slide shows Revenue Split – By Product And Segment graph. Add relevant information here and make use of it.
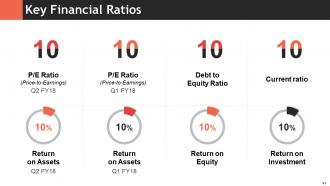
Slide 41: This slide presents Key Financial Ratios of- P/E Ratio, Debt Equity Ratio, Current Ratio with- Return on Assets, Return on Equity, Return on Investment, Return on Assets.
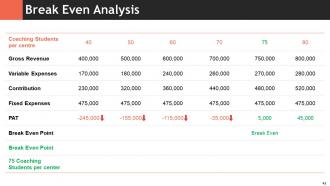
Slide 42: This slide presents Break Even Analysis in a tabular form.
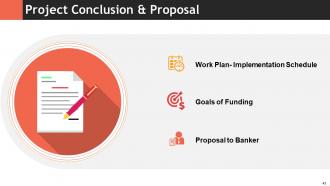
Slide 43: This is Project Conclusion & Proposal slide showing- Work Plan- Implementation Schedule, Goals of Funding, Proposal to Banker.
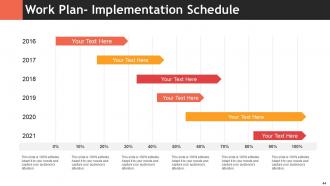
Slide 44: This slide shows Work Plan- Implementation Schedule gantt chart.
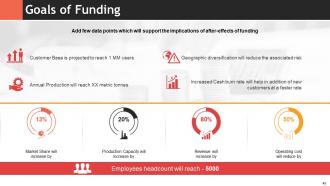
Slide 45: This slide shows the Goals of Funding. Add them here and use it accordingly.
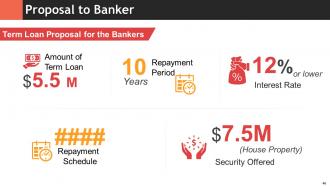
Slide 46: This is Proposal to Banker slide showing Term Loan Proposal for the Bankers.
Slide 47: This slide is titled Charts & Graph to move ahead. Alter/ modify as per your need.
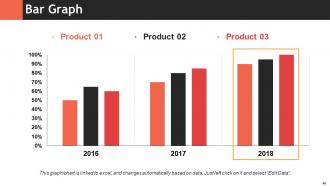
Slide 48: This is a Bar Graph image slide to show product comparison, growth etc.
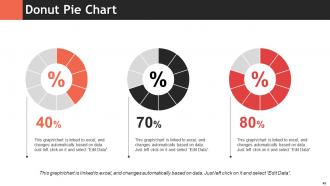
Slide 49: This is a Donut Pie Chart slide to present product/ entity comparison, specifications etc.
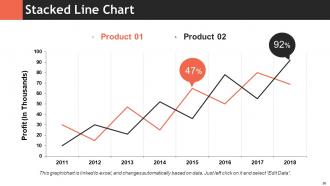
Slide 50: This slide presents Stacked Line Chart. Compare Product 01, Product 02 here and use as per your need.
Slide 51: This slide is titled Additional Slides. You can change the slide content as per your needs.
Slide 52: This is Vision & Mission slide. Showcase your vision and mission here.
Slide 53: This is Our team slide with names and designation.
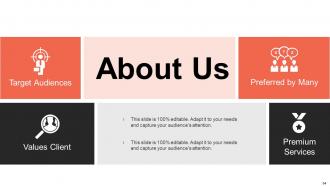
Slide 54: This is an About us slide to state company specifications etc.
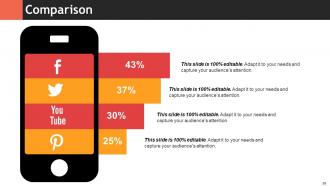
Slide 55: This is a Comparison slide to show product/ entity comparison etc.
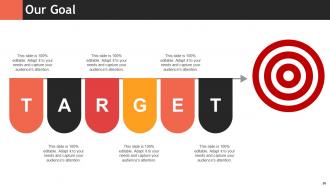
Slide 56: This is Our Goal slide. State your important goals here.
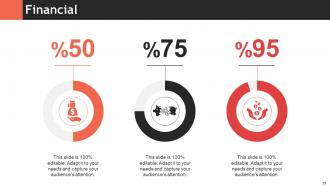
Slide 57: This slide presents Financial scores to display.
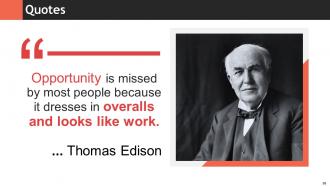
Slide 58: This is a Quotes slide to highlight, or state anything specific.
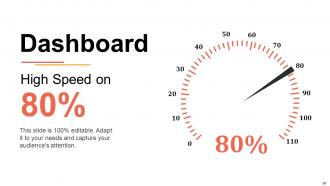
Slide 59: This is a Dashboard slide to state Low, Medium and High aspects, kpis, metrics etc.
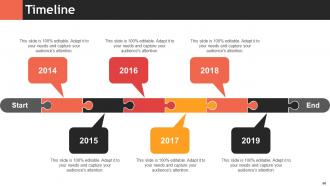
Slide 60: This is a Timeline slide to present important dates, journey, evolution, milestones etc.
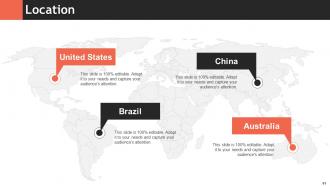
Slide 61: This is a Location slide to show global segregation, presence etc. on a world map and text boxes to make it explicit.
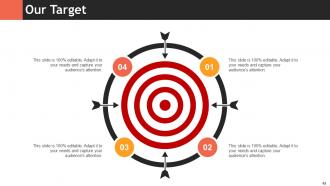
Slide 62: This is Our Target slide with imagery. State your targets here.
Slide 63: This is a Mind map image slide to show information, specifications etc.
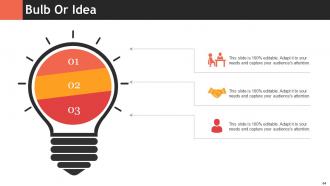
Slide 64: This is a Bulb or Idea image slide to show ideas, innovative information etc.
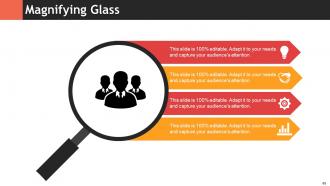
Slide 65: This is a Magnifying Glass image slide to show information, specifications etc.
Slide 66: This is a Thank You slide with Address# street number, city, state, Contact Number, Email Address.
Project Appraisal Powerpoint Presentation Slides with all 66 slides:
Avoid collateral damage with our Project Appraisal Powerpoint Presentation Slides. They ensure there are no harmful effects.









FAQs for Project Appraisal
Okay so you'll want to hit the big stuff first - financial analysis like NPV and ROI, plus risk assessment and whether it's even technically doable. Stakeholder impact matters too. Then look at your resources, timeline (be realistic here), and if it actually fits your company's goals. Market analysis is huge - seriously, I've watched projects crash because teams totally ignored this step. Oh, and don't forget regulatory stuff if that applies. My advice? Start with a solid framework covering these areas, then focus on what matters most based on how complex and expensive your project is.
So basically, quantitative methods are all about the hard numbers - NPV, ROI, payback period, that kind of stuff. Gets you the financial picture. Qualitative is more like... does this actually make sense for where we're going as a company? Will people be happy with it? What could go wrong? It's kinda like buying a car (or house, whatever). Sure, you need to crunch the numbers first - can you afford it, what's the resale value. But you also gotta think about whether you'll actually enjoy driving the thing. I'd say start with the math to see if it's even feasible, then dive into the strategic stuff.
Dude, you absolutely have to do stakeholder analysis before diving into any project. Map out everyone who'll be impacted - users, bosses, outside partners, the works. Figure out what they want, how much power they have, and what might piss them off. I learned this the hard way on my last project when finance blindsided us halfway through. It shapes everything: your risks, budget, how you'll actually execute. Honestly, people underestimate how political projects get. Skip this and you're shooting in the dark. Oh, and keep updating it - stakeholders change their minds constantly.
Dude, risk assessment will totally change your whole project picture. Once you start looking at what could actually go wrong - budget blowouts, delays, market shifts - your numbers get way more real. I've watched projects that seemed like slam dunks get axed after someone finally did the risk math. Pretty brutal honestly. You gotta be honest about probability and impact though. List out your biggest 5-7 risks and figure out how they'd mess with your ROI. Your projections won't be as pretty, but at least they'll be accurate instead of wishful thinking.
So the main ones are NPV, IRR, and payback period - you'll run into these constantly. NPV shows the actual dollar value added, IRR is your percentage return, and payback tells you how fast you get your money back. Honestly, most teams I've worked with just focus on NPV because it's way more straightforward. I'm kind of biased toward it too. Some places also use ROI or profitability index, but that varies by company. My advice? Start with NPV calculations and you're golden. Oh, and don't let anyone overcomplicate this stuff - happens all the time.
Honestly, you can't ignore environmental stuff anymore when evaluating projects. Investors will grill you on carbon footprint, waste, resource use - the whole deal. Compliance with environmental regs is huge too. I mean, nobody wants their project shut down halfway through because of some environmental issue they missed, right? The trick is actually putting numbers on this stuff and working it into your cost-benefit analysis. Don't just check a "green" box and call it done. Environmental risks will bite you later if you half-ass the assessment upfront.
Depends what kind of project you're dealing with, honestly. NPV and IRR are the classics for financial stuff - can't go wrong there. Payback period too if you need something simple. Cost-benefit analysis works for bigger picture things. There's also this thing called MCDA that's actually pretty useful when you've got weird qualitative factors to juggle, though most people haven't heard of it. Risk matrices help you figure out what could go sideways. SWOT's solid for strategy work. I'd probably start with the money stuff first, then add risk analysis depending on who you're presenting to.
Dude, cultural stuff will absolutely sink your international project if you're not careful. Local business practices, communication styles, decision hierarchies - they all matter way more than you'd think. I got burned on a Southeast Asia project because we didn't budget enough time for relationship-building (rookie mistake). Different cultures handle risk totally differently too. Some places move fast, others need consensus from like 15 people before deciding on lunch. Get local team members involved from the start and build those cultural adaptation costs into your budget upfront. Trust me on this one.
So basically, cost-benefit analysis is just putting dollar signs on everything to see if a project's actually worth it. You compare all the costs against the benefits over time - sounds boring but honestly it'll save you from some really dumb decisions. It helps you figure out which projects to prioritize when you've got limited money. Plus stakeholders love seeing the numbers laid out. The trick is remembering to include the weird costs too, not just the obvious ones. I learned that the hard way on a project last year! Run the math first, then decide.
Look, project appraisal basically saves you from those "oh crap, what did we just spend money on" moments. You're getting real data on costs, timeline, risks - all that stuff that lets you actually compare your options instead of just guessing. Honestly, it's like doing a sanity check before you blow your budget. Plus your boss will be way more likely to approve things when they see you've thought it through. The stakeholders eat that up too. Just start simple - do a basic cost-benefit breakdown and figure out what could go wrong for anything big.
Honestly, the worst thing you can do is be way too optimistic with your numbers - we all fall into that trap. Don't use old market data either, and seriously don't underestimate how much stuff will actually cost. Implementation always gets messy. Oh and the stakeholder thing? Super important but boring - if you miss someone important early on, they'll show up later and mess everything up. I've seen people get so caught up in the financial side that they completely ignore whether it's actually doable operationally. Build in extra time and money from day one. Run some worst-case scenarios before presenting too.
Look at what actually happened on your last few projects instead of just winging it. Historical data is honestly a lifesaver for realistic estimates. You'll catch those sneaky budget overruns and timeline issues that always seem to pop up. I usually dig into 3-5 similar projects first - same team size, complexity, that kind of stuff. The patterns are pretty obvious once you start looking. Maybe Project A always went 20% over on testing, or everyone underestimated deployment time. Build those lessons into your contingencies now. Way better than getting blindsided later when your boss asks why you're behind schedule again.
Honestly, tech can be a game-changer for project appraisal. Automated tools pull all your financial data and risk stuff without the manual grunt work. AI analytics catch patterns you'd probably miss - though sometimes they flag weird things too. Your team can review projects at the same time using digital platforms instead of that endless email chain nightmare. Scoring templates keep everything consistent, and reports generate themselves. You'll spend way less time on paperwork. I'd start by automating whatever repetitive tasks are driving you crazy first.
Look, it really depends on your industry's biggest pain points. Tech companies should prioritize scalability and getting to market fast. Manufacturing? Focus on efficiency and safety compliance instead. I've watched so many healthcare startups crash because they totally underestimated FDA approval times - regulatory stuff will destroy you if you're not careful. Financial services obviously need bulletproof security metrics. Retail's all about customer acquisition costs and how quickly you can penetrate markets. Honestly, just figure out your industry's top three deal-breakers first, then build your whole scoring system around those priorities.
Honestly, map out everyone who has a say first - figure out what they ACTUALLY want, not what you assume. Finance people? They want hard ROI numbers. End users just care if it'll make their job easier or harder. Skip the mass emails (they're useless anyway) and do workshops where people can actually talk. Oh, and create ways to get feedback during the whole thing, not just at the end when you're screwed if something's wrong. Start by asking each group what winning looks like to them personally. You'll save yourself so much headache later.
-
Easy to edit slides with easy to understand instructions.
-
Easily Editable.