

Project management overall progress dashboard






Try Before you Buy Download Free Sample Product
 Impress Your
Audience
 100%
Editable
 Save Hours
of Time


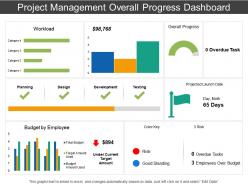
Use our project management overall progress dashboard presentation design to share the information related to the project development. Reporting is an essential aspect of work management as the project managers are asked to create regular reports on progress against budget, schedule and scope. This PowerPoint template assists you to assess the overall progress of the project and then work on the future strategy accordingly. You can present information about some key aspect of the project such as workload, budget by employee, overdue task etc. Now sharing all this information in one PPT design needs you to do complete research and then create the presentation diagram that should make an impact when you share it with your clients. Keeping a regular check on the project status enables you to manage the task in the effective manner as you can change your work strategy and pay attention towards the concerned areas. The PowerPoint graphic is available in excel format, so you can edit the data and content according to your business and then present it among your team mates or even clients. Avoid alienating a few colleagues with our Project Management Overall Progress Dashboard. They ensure everyone gets equal attention.
People who downloaded this PowerPoint presentation also viewed the following :
Project management overall progress dashboard with all 6 slides:
Make your ideas stand out in the crowd. Project Management Overall Progress Dashboard are ready for your individual needs.


FAQs for Project management
Stick to the basics first - timeline, budget vs what you're actually spending, task completion, and how you're using your resources. Team workload distribution is huge too because you can catch bottlenecks early. I'd also track any blockers or risks that need quick action. The thing is, most dashboards I've seen are just information overload. Nobody wants to dig through charts to figure out if a project's on track. Keep it simple enough that someone can look at it for like 10 seconds and know what's up. You can always add more metrics later if people actually ask for them, but honestly? They probably won't.
Dude, seriously get a project dashboard set up. No more "hey what's happening with that thing" messages every five minutes. Everyone can just check one spot to see deadlines, who's stuck on what, all that stuff. Real-time updates are clutch because you'll catch problems early instead of scrambling later. Your team will actually know how their work fits together too. I swear your morning standups will be so much less painful - we used to spend half the meeting just figuring out basic status updates. Use whatever tools you've already got and just start simple.
Honestly, it depends on your team size. Asana and Monday.com are pretty solid choices - good dashboards without being overwhelming. Notion's great too if you want something flexible. Already using Microsoft stuff? Then Project makes sense. Trello's fine for basic projects but gets limiting fast (trust me on this one). Bigger teams might need Smartsheet or Jira for better reporting. My take: grab free trials of like 2-3 options and actually test them on a real project first. Way better than guessing what'll work.
Automated syncing is your best bet here - hook your dashboard straight into Jira, Asana, whatever you're using. Manual updates? Yeah, those never happen consistently. For refresh rates, I'd do 15 minutes for the critical stuff like budgets, hourly for everything else. Build some validation rules too so weird data gets caught before it shows up. Oh and definitely have someone spot-check things weekly against your actual source systems. I learned that one the hard way when our "green" project was actually three weeks behind schedule.
Dashboards are live data - they update automatically and you can click around to dig deeper into stuff. Status reports? Those are just frozen snapshots from whenever someone wrote them. Like, by the time you get that weekly email, half the info is already stale. With dashboards you've got charts and graphs showing what's happening right now, so you can catch problems before they blow up. Honestly, I'd stick with dashboards for day-to-day management and only use reports when you need something formal for the higher-ups.
Honestly, just think about what each project type actually needs first. Software stuff? Sprint burndowns and bug tracking. Construction? Resource allocation and hitting milestones on time. Most tools let you drag and drop widgets around - way easier than it sounds. I'd start with your top 3-5 metrics that stakeholders actually give a damn about, then build from there. The whole thing's pretty intuitive once you mess around with it for like 10 minutes. You can always change things later anyway.
Honestly, good visuals are what make dashboards actually useful instead of just pretty. You don't want to dig through boring spreadsheets every morning - charts and color-coded stuff help you catch problems way faster. Like, if something's going red, you know there's an issue without reading a bunch of numbers. Pick the right chart type for what you're tracking though. Progress bars for timelines, graphs for trends, that kind of thing. Figure out what decisions you're making daily first. Then build visuals that make those calls super obvious when you glance at your screen.
So basically, dashboards are amazing because everyone can see the same info at once. No more creating separate reports for every single meeting - trust me, you'll save hours. Stakeholders can just log in whenever and check progress, budgets, timelines, whatever they need. The charts make everything super visual too, which helps when you're dealing with executives who aren't technical. Oh, and set up those automated email snapshots! Otherwise you'll be constantly bugging people to actually look at the thing. It keeps everyone in the loop without you doing extra work.
Don't cram everything onto one screen - that's the classic trap. People think more data = better insights, but you just get dashboard paralysis where nobody touches it. Skip vanity metrics too (like total hours logged). Focus on stuff that actually drives decisions instead. Your execs don't need complex Gantt charts, honestly - give them simple red/yellow/green status dots. I'd stick to maybe 5-7 key metrics tops. Oh, and definitely test it with real users first before you roll it out company-wide, otherwise you're just guessing what works.
So basically most dashboards connect through APIs or those built-in connector things with stuff like Jira, Trello, Asana. Usually you'll find this in settings under "integrations." Honestly some tools work way better together than others - can be super annoying. The trick is getting your data fields mapped right so tasks and deadlines actually sync properly. Oh and definitely start with just one tool first to test it out. I learned that the hard way lol. Once you get the hang of it, then add more connections gradually.
Honestly, bar charts are perfect for comparing how different teams are doing. Line graphs work really well for trends - like watching your budget disappear over time lol. For resource breakdowns, pie charts are solid but they get ugly fast if you have too many pieces. You'll definitely want Gantt charts for timelines, and those big KPI number cards catch people's eyes for stuff like completion rates. I'd say start with whatever metrics your stakeholders actually care about first. Don't overthink the colors but keep them consistent so people can scan quickly.
Honestly? Daily updates are best, but weekly works if you're swamped. Just pick something and stick with it - consistency matters way more than frequency. I've watched so many dashboards turn into digital graveyards because someone updated them religiously for two weeks then... crickets. Nobody trusts old data, and frankly, I don't blame them. Real-time updates are clutch for crazy-tight deadlines if your system can handle it. Set a calendar reminder and actually follow it. Treat it like brushing your teeth - boring but necessary.
Honestly, skip the boring feature demos and just throw people into real scenarios right away. Let them click around - way more effective than watching you do it. Cover the basics first though: updating tasks, reading timelines, those color indicators (which are pretty intuitive once you get the hang of it). Quick reference guides are clutch for bookmarking. Pick a few tech-savvy people as your go-to troubleshooters on each team - you'll thank me later. Give everyone practice time before making it mandatory or you'll get pushback.
Honestly, dashboards are game-changers for catching problems early. They track stuff like budget overruns and timeline delays in real-time, so you're not scrambling later. I love how visual they are - patterns jump out that you'd totally miss in boring spreadsheets. Plus you can set alerts for when things hit certain thresholds. Like if your project's running 20% over budget, boom - notification. Way better than manually checking everything constantly (who has time for that?). Set your risk limits upfront and let it flag issues before they blow up into actual disasters.
Honestly, notifications for deadline changes are a game changer - can't tell you how many times I've seen projects derail because someone missed an update. Time tracking integration will show you where hours actually disappear (spoiler: it's never where you think). Risk widgets help catch problems early, which saved my butt more than once. Budget tracking prevents those awkward "we're over budget" conversations. Oh, and workload visualization stops people from burning out. Start with whatever's driving your team crazy right now - probably notifications or time tracking if your estimates are consistently wrong.
No Reviews