


Project management status description powerpoint slide rules





Try Before you Buy Download Free Sample Product
 Impress Your
 Audience
 100%
100% Editable
 Save Hours
 of Time


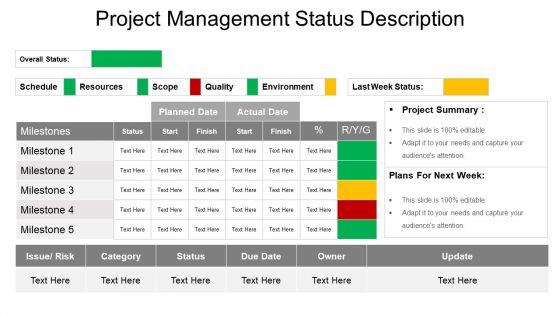
If you are looking for an ideal template to present your Project Management Status Description presentation, then this PowerPoint slide is apt for you. You can download this PPT for project communication and present your project’s management report description with ease. As progress status reporting is an essential activity of project communication, this professionally designed template is a must – have for a project manager like you. You can use this project report PPT design to cover details like variations in the planned deadlines versus the actual dates of various milestones. The slide has separate tables to display issues or risks involved, status, due dates and owners. All the required information related to project management updates can be covered here. Separate text boxes on one side cater to your data related to project summary, briefs and future scheduling. Hence, it makes this single slide a complete package which covers all the essentials of an ideal project management status description PPT. You must employ this tool to make your report more effective and for better implementation of plans. Presenting the related data in a tabular form will display the trends that the executives can assess conveniently. This visually - engaging template design will ease out your task of presenting the enormous data. Also, the client will interpret it effortlessly. So, download this template at the click of a button. Decisions begin to go in your favour due to our Project Management Status Description Powerpoint Slide Rules. It ensures good impressions form.
People who downloaded this PowerPoint presentation also viewed the following :
Project management status description powerpoint slide rules with all 5 slides:
Analyze ineffectual attempts with our Project Management Status Description Powerpoint Slide Rules. Figure out how to increase the impact.

FAQs for Project management status description
Schedule stuff is obvious - are you hitting milestones or nah? But honestly, I'd watch budget variance and scope creep like a hawk. Team velocity tells you everything too. Resource allocation gets messy fast when your best people are swamped or MIA. Stakeholder silence is deadly - if sponsors go quiet, something's wrong. Quality metrics like defect rates matter, but don't sleep on gut feelings during standups. Sometimes your team knows problems before the data shows it. Just build a simple dashboard mixing these so you catch issues early instead of firefighting later.
Honestly, just match your updates to who you're talking to. Executives want the quick version with any red flags called out. Team leads need the nitty-gritty details. Visual dashboards are your friend - nobody reads giant paragraphs anymore. Set up a rhythm that works: weekly for active stuff, every other week for maintenance projects. Start with the big question first - are we good, screwed, or somewhere in between? Budget issues? Timeline problems? Then get into specifics. Oh, and make templates for different groups. You'll thank me later when you're not reinventing the wheel every single time.
Honestly depends on your team size, but I'd start with Asana or Monday.com - they're pretty solid for tracking and reporting. Trello's great too if you want something dead simple (I actually prefer Kanban boards half the time). Microsoft Project works well if you're already stuck in their ecosystem with Teams and everything. Most of these generate okay dashboards, though you'll probably still end up exporting stuff to Excel for the higher-ups - they love their spreadsheets. My advice? Figure out how your team actually works first, then find the tool that fits. Don't try to force some fancy system that nobody will use.
Ugh, scope changes are such a pain because they mess with literally everything in your status report. You'll have to update timelines, budgets, milestones - the whole nine yards. Stakeholders get super anxious about this stuff too, so be ready for lots of questions. I always create a separate section just for scope changes now. Document what changed and why, plus how it impacts your schedule and costs. Honestly, it's way easier to track everything in one spot than scrambling to explain changes scattered throughout your report. Your future self will thank you when someone inevitably asks "wait, when did we add that feature?"
Honestly, watching team morale tells you way more about your project than any status report. Happy teams crush problems and flag issues early. But when morale drops? Everything falls apart fast - missed deadlines, sloppy work, people going radio silent even when stuff's broken. I've watched projects that looked perfect suddenly implode because nobody felt safe speaking up about the real problems. Your standups and one-on-ones are gold for catching this early. Sometimes I think we get so obsessed with our metrics that we forget the humans actually building the thing.
Look for patterns in your status updates - missed deadlines, budget issues, team members bringing up the same problems over and over. Anything that's been yellow for more than two weeks? Yeah, that's about to go red. Watch for slipping dependencies and resource conflicts too. Honestly, the biggest thing is getting your team to actually speak up early instead of trying to fix everything solo. People hate admitting when stuff's going sideways. Start a simple risk log and go through it weekly in your status meetings. Makes a huge difference once everyone gets used to it.
Ugh, the worst thing you can do is write a freaking novel - people's eyes just glaze over. Be super specific about what's actually happening, not just "things are going well." Skip the fluff. Put the important stuff up front and use bullet points so people can scan it quickly. Oh, and don't forget risks! Stakeholders get pissed when bad news comes out of nowhere later. Match your audience too - your CEO doesn't care about the same technical stuff your developers need. Always end by telling them exactly what you need from them. Honestly, most status updates I see are just painful to read.
Your project's status basically controls everything - how you divvy up resources, what you do next. On track? Stick with the original plan. Behind schedule? You've got three options: throw more people at it (terrible idea honestly, just creates chaos), push deadlines, or cut features. Ahead of schedule? Perfect time to shift people over to projects that are struggling. I learned this the hard way - you really need to update those resource forecasts every week based on what's actually happening. Don't just cross your fingers hoping it'll fix itself, because it won't.
Oh man, Agile completely changes the game with status updates. Instead of those awful monthly reports, you're constantly communicating through daily standups and sprint reviews. The whole conversation shifts too - less "are we on time?" and more "what are we actually delivering and what's stuck?" You'll be talking about user stories completed, velocity trends, sprint goals. Way better than waterfall where everything seems fine until it totally isn't (learned that the hard way). Track your team's velocity though - that's what makes your updates actually useful to stakeholders instead of just noise.
Honestly, most people overthink this and end up with dashboards that are complete garbage. Stick to the basics: schedule performance, budget variance, resource utilization, and risk counts. Are you hitting milestones? Going over budget? Is anyone drowning in work? That's what matters. If you're doing development work, throw in some quality stuff like defect rates. The whole point is someone should be able to glance at it and know if things are going well or if it's time to panic. Thirty seconds max - if it takes longer than that, you've failed.
Honestly, I'd go with weekly reports for most projects. Daily is way too much unless everything's on fire, and monthly? That's how stuff falls through the cracks. I found that out the hard way when a project completely derailed between check-ins - not fun explaining that to the boss! Weekly gives people time to actually get things done while keeping everyone in the loop. You can still catch problems early this way. Plus stakeholders won't hate you for spam. Start there and see how it feels - some projects might need tweaking based on complexity.
Honestly, daily standups can get pretty tedious - I'd go with shared boards like Trello instead. Way better for remote teams. Set up those visual dashboards so everyone sees what's happening in real-time. Keep your status updates super consistent though - same format every time or stuff gets messy fast. Oh, and make sure people actually speak up about blockers right away instead of sitting on problems. Nobody wants surprises later. Automated notifications help too, but don't go overboard with the micromanaging thing. People hate that.
So basically, closure phase completely changes your status reports - instead of "what's happening" it becomes "what did we actually accomplish and learn." You're documenting final outcomes and whether you hit your goals. Way more useful than those annoying weekly check-ins honestly! Focus on what worked, what bombed, and any curveballs that came up. Don't forget to note how resources performed and what stakeholders thought. Trust me, you'll be so glad you captured this stuff when your next similar project rolls around. Future you will thank present you for the solid historical record.
So status reports are basically "here's where we stand right now" - budget, timeline, any fires we're putting out. Progress reports are more like "look what we actually got done since last time." People mix them up all the time though, which honestly makes sense because they overlap. Status gives the big picture snapshot. Progress shows the momentum and what's next on deck. I'd say go with status when your stakeholders want that bird's eye view, and progress when they're asking "what have you been doing with my money?" You know how they get.
You know how spreadsheets make your brain hurt? Data visualization fixes that. Turn all your messy project info into simple charts and dashboards that actually make sense. Gantt charts show bottlenecks right away, progress bars tell you where you stand, and burn-down charts reveal if you'll hit deadlines. Your stakeholders won't zone out during meetings anymore – trust me on this one. Teams spot issues way faster when they can see what's happening instead of guessing. Honestly, start small with basic charts first. You can build fancier dashboards later once you get the hang of it.
-
Nice and innovative design.
-
Unique and attractive product design.