


Property Dealer Sales Dashboard By Power BI




Try Before you Buy Download Free Sample Product
 Impress Your
 Audience
 100%
100% Editable
 Save Hours
 of Time


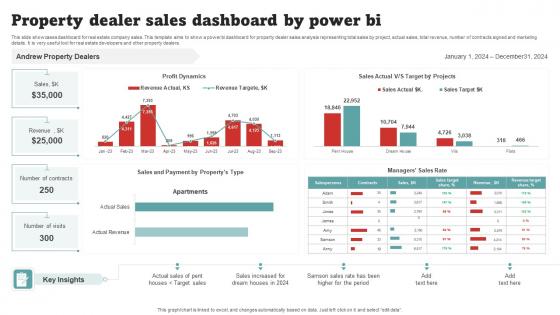
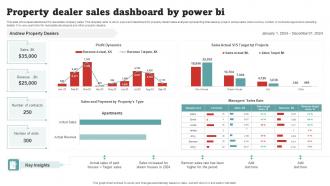
This slide showcases dashboard for real estate company sales. This template aims to show a power bi dashboard for property dealer sales analysis representing total sales by project, actual sales, total revenue, number of contracts signed and marketing details. It is very useful tool for real estate developers and other property dealers.
People who downloaded this PowerPoint presentation also viewed the following :
Property Dealer Sales Dashboard By Power BI with all 10 slides:
Use our Property Dealer Sales Dashboard By Power BI to effectively help you save your valuable time. They are readymade to fit into any presentation structure.








FAQs for Property Dealer Sales Dashboard
Track your lead conversion rates and average deal size first - those are huge. Sales cycle length matters too. I'd throw in active listings and showings booked since that shows momentum. Pipeline value by stage is clutch for forecasting. Obviously commission earned and monthly deals closed because, well, money. If you do property management, track that recurring revenue - it's honestly the best part of the business. Lead sources are key so you know if Facebook ads are actually worth it or just burning cash. Start simple with these, then get fancy later once you're not drowning in data.
Dude, spreadsheets are brutal - nobody wants to scroll through endless rows of numbers. Heat maps and interactive charts totally change the game though. Your agents can actually see what's happening with sales velocity by area, price trends, all that good stuff. Commission tracking becomes way less painful when it's visual. I swear, dashboards just click better in people's brains than tables do. Start with whatever metrics your team checks every single day - like lead conversion or inventory levels - and build widgets around those first. Trust me, they'll spot opportunities they'd completely miss otherwise.
Dude, real-time data is everything in this market. You'll spot price shifts and trends right as they happen instead of finding out weeks later when it's too late. Hot properties? You can jump on them before other agents even know they exist. Plus you're actually responding to what buyers want TODAY, not what they wanted last month (which honestly feels like ancient history these days). The dashboard breaks down which listings are getting views and where demand's going crazy. Oh, and definitely set up alerts for the stuff that matters most - trust me, you don't want to be that agent still working off stale reports while everyone else is moving fast.
Definitely dig into your historical data to spot seasonal patterns and price trends. Moving averages help smooth out the wonky months (trust me, there's always weird outliers). Year-over-year comparisons are clutch for seeing the bigger picture. Honestly, neighborhood breakdowns are where it gets really interesting - you'll see which areas consistently outperform. Set alerts when current numbers stray too far from your norms. That's when you know it's time to pivot your pricing or maybe focus on different property types. Days on market data is gold too, btw.
Dude, put your biggest KPIs like sales and conversion rates top-left - that's where people look first. Group similar stuff together (lead sources, pipeline data, commissions) so it makes sense. The "5-second rule" is clutch here - users should get the main insights super quick. Honestly, most dashboards I see are just data vomit. Don't do that! Keep colors consistent, leave breathing room with white space, and make filters easy to find. Oh, and definitely test it with real users first - you'll catch issues you never thought of. Trust me on this one.
Okay so CRM integration is seriously worth it - it pulls all your lead data, contact history, and pipeline stuff straight into your dashboard. No more switching between a million tabs. You'll see everything about each prospect in one spot: what properties they want, when you last talked, upcoming follow-ups, all that. The real-time sync keeps everything current too. Honestly, tracking hot leads and spotting sales patterns becomes so much easier. I'd probably start with whatever CRM you use most and go from there. Makes staying organized way less of a headache.
Start with role-based permissions - agents see their deals, managers see everything. Multi-factor authentication is a must since property data draws hackers like crazy. Encrypt client info when it's stored and moving around. Audit logs help you track who looked at what and when (saved my butt once when someone claimed they never accessed a file). Session timeouts are huge because people always leave dashboards open on office computers. I'd tackle user permissions first since that's honestly where most security fails happen. The rest you can layer on after.
Dude, mobile compatibility is a game changer when you're constantly running around showing properties. You can check lead status while grabbing coffee between showings, update client info right from the car, or pull up listing details during a walk-through. Trust me, there's nothing worse than a client asking about square footage and you're standing there like an idiot without the info. Response time matters too - if someone inquires about a property, you can hit them back instantly instead of waiting until you're back at the office. Just grab the app or bookmark the mobile site.
Honestly, start by breaking down your customer data by demographics and buying habits - that's where the gold is. Your dashboard will show who's actually buying vs. just window shopping, plus which neighborhoods different buyer types prefer. Seasonal trends are huge too, don't sleep on those. The repeat customer stuff is probably my favorite part to dig into since it shows your referral game. First-time buyers usually stick to certain price ranges while investors are all over completely different areas. Oh, and use this intel to tweak your marketing - way better ROI when you're targeting the right people.
Dude, geo visualizations are game-changers for real estate. Map out your data and boom - you'll see which areas are hot and which ones have properties just sitting there forever. Heat maps show price patterns way better than staring at boring spreadsheets all day. I swear, clients get it so much faster when you show them visual market trends instead of explaining with numbers. You can spot neighborhoods you're totally missing too. Honestly, just throw your last quarter's sales on a map first - you'll probably find some obvious gaps in like 5 minutes.
Honestly, just pick like 4-6 things that actually matter - lead conversion, pipeline value, time-to-close. That's it. I've seen so many teams get obsessed with cramming every metric they can think of onto one dashboard and it's a total mess. Skip the vanity stuff that looks cool but won't help you close anything. Make sure it updates often enough to be useful (nobody wants yesterday's data for today's decisions). Oh, and definitely test it with real users first - learned that one the hard way. You can always add more later once people get comfortable with the basics.
Get in touch with the property dealers who'll actually use this thing daily. User interviews work great - watch them try to track leads or analyze market trends in real-time. Way more useful than surveys, honestly. Nobody's gonna sugarcoat it when they're frustrated with a clunky interface. Build feedback options right into the dashboard so they don't have to email you every time something's broken. Focus on fixes that'll make their workday smoother first. Monthly check-ins should keep you on track with the most important stuff they're asking for.
Dude, get a sales dashboard ASAP. You can finally ditch those messy spreadsheets and track every client conversation in one spot. Never miss another follow-up (because we both know how that goes). The best part? During calls, you'll have their whole history right there - no more awkward "remind me what you were looking for again" moments. Honestly, it's like having a personal assistant for your brain. Shows you exactly which properties fit their needs and where everyone sits in your pipeline. Start with your top 20 prospects first, then expand from there.
Honestly, the trend analysis stuff in your dashboard is where the magic happens. Check price movements across neighborhoods and track how long places sit on the market. Heat maps are clutch for seeing patterns you'd totally miss otherwise - I swear by those things. Also peek at where your leads are coming from since that shows demographic shifts way before they're obvious to everyone else. Days-on-market data tells you which property types are moving fast. Set up weekly check-ins so you can adjust your inventory before you're behind the curve.
Dude, start with lead scoring - it'll pay for itself immediately by showing you which prospects are actually worth your time. Price forecasting is solid too once you get your data cleaned up. Customer churn prediction is clutch for keeping your best clients around. Sales forecasting helps with planning, obviously. Market timing predictions are honestly where things get interesting though - they'll tell you exactly when to push specific properties. I'd probably skip the fancy stuff at first and just focus on lead scoring. You can always add the other predictive tools later once you're seeing results.
-
Design layout is very impressive.
-
Wide collection of templates available. SlideTeam has made it easier to create presentations in just a few minutes.